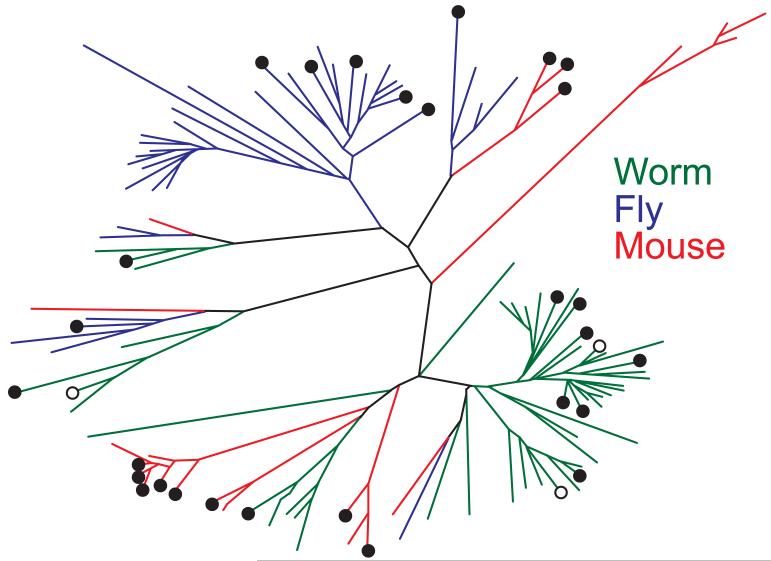
Figure 1.
Phylogenetic tree of the GST gene families from worms, flies, and mice. Genes from each species are color-coded, and significantly (q < 0.1) differentially expressed genes in long-lived IIS mutant C. elegans, D. melanogaster and mice are shown by closed (up-regulated) or open (down-regulated) circles. There is little gene-to-gene orthology between species, because the extant genes are largely the product of lineage-specific expansions. The GSTs in each species therefore usually have a more recent common ancestor than the common ancestor of C. elegans. D. melanogaster and mouse.

