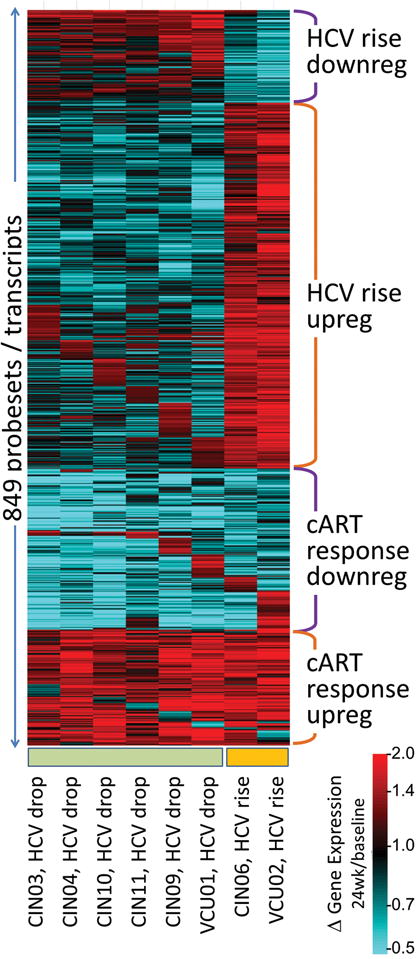
Figure 3.

Heat map of gene expression changes that occurred following cART treatment in HIV/HCV co-infected patients. Gene expression changes are depicted as the ratio of gene expression at 24 weeks following cART compared to baseline gene expression prior to treatment. Genes that decrease from their baseline values are blue, and those that increase are red. Four clusters are indicated corresponding to genes that (i) increased or (ii) decreased following cART treatment in the patients whose HCV titers rose, (iii) that increased in response to cART for nearly all patients, and (iv) that decreased in response to cART. A change in expression pattern can be seen between the first 6 patients on the left who had a drop in HCV titer, as compared to the 2 patients on the right who had a rise in titer.
