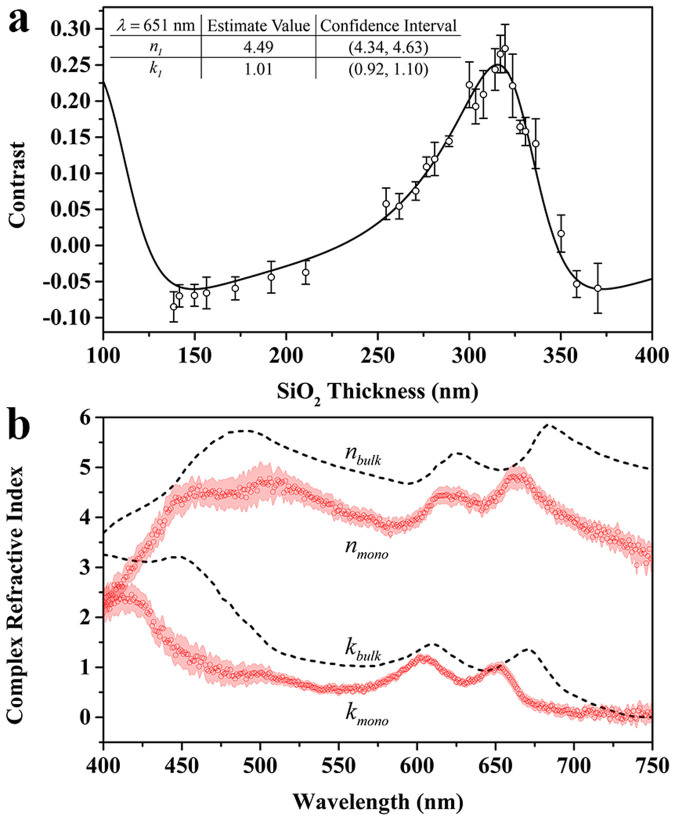
Figure 3. Curve Fitting results of complex refractive index for monolayer MoS2.
(a) The contrast of monolayer MoS2 as a function of the SiO2 thickness under incident light wavelength of 651 nm (scattered open circles). The standard deviation of each point is shown by the error bar. The curve fitting result of the complex refractive index of monolayer MoS2 at 651 nm is shown in the table in the inset. (b)The complex refractive index spectrum (scattered red circles) of monolayer MoS2, obtained by curving fitting the relation between contrast and SiO2 thickness relation with equation (3) under different incident light wavelength (from 400 nm to 750 nm). The red shadow shows the confidence interval, corresponding to a 95% confidence level. The black dashed lines show the complex refractive index spectrum of bulk MoS221.

