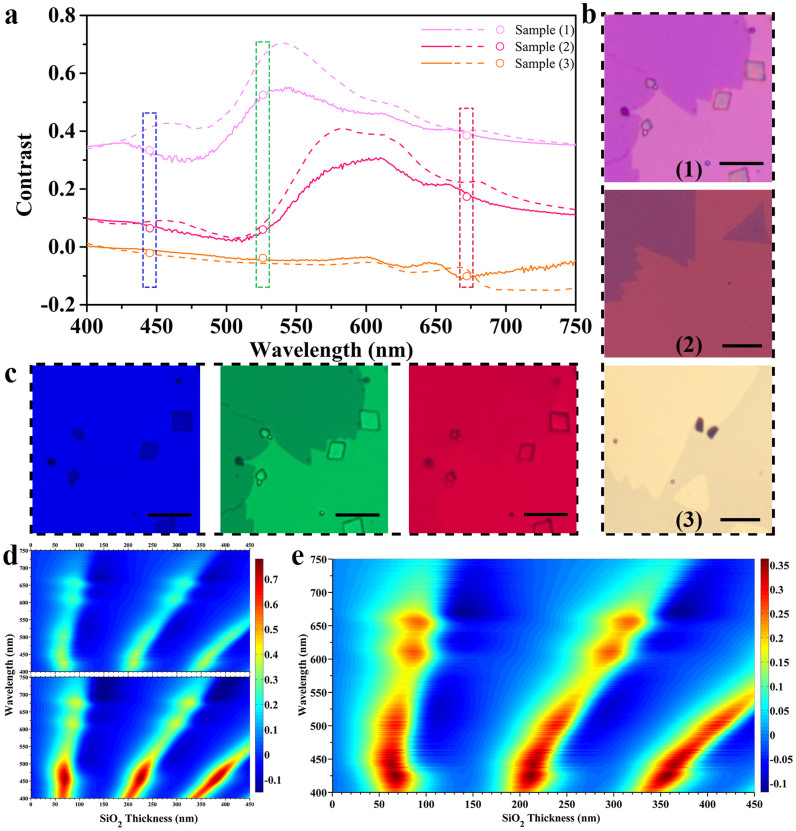
Figure 4. Comparison of the optical contrasts of monolayer MoS2 on SiO2/Si substrates calculated with the refractive index of monolayer MoS2 and that of bulk MoS2.
(a) Three representative contrast spectra of monolayer MoS2 on different substrates, calculated with the refractive index of monolayer MoS2 (solid lines), together with those calculated with the refractive index of bulk MoS2 (dashed lines). The samples (1)–(3) correspond to SiO2 thicknesses of 262, 281, and 150 nm, respectively. The scattered open circles are the contrast data obtained directly from the monochromatic images of the three samples. (b) The optical images of samples (1)–(3). (c) The monochromic (blue, green, and red) images of sample (1) under 445 nm, 526 nm, and 672 nm light illumination, respectively. (d) The upper and lower ones are the color contour plots of the contrast as a function of both SiO2 thickness and incident light wavelength calculated using the refractive index of monolayer MoS2 and that of bulk MoS2, respectively. (e) The redrawing of the upper one in (d) using a different color bar. All the scale bars in Fig. 4 correspond to 10 μm.

