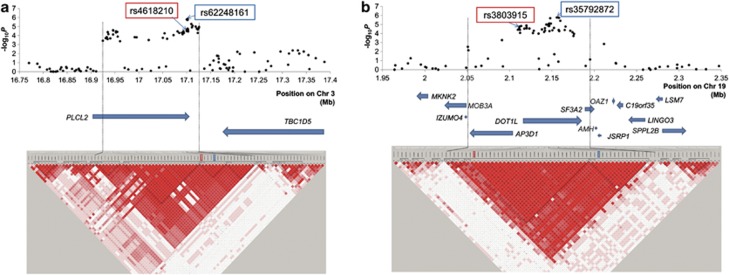
Figure 3.
Case–control association plots, LD map, and genomic structure of the newly identified regions. LD map and genomic structure of the regions on chromosome 3p24.3 (a) and on 19p13.3 (b). The associated regions are shown between the two black dashed lines. The black dots represent the –log10 P-values obtained from GWAS and genotyping SNPs that showed PGC <1.0 × 10⁻⁴ in the imputation. We drew the LD map based on D' values using the genotype data from the cases and controls in the GWAS samples. The arrows indicate the locations of genes. SNPs in red-lined box were identified in GWAS as a marker SNP highly associated with MI, and SNPs in blue-lined box are top associated SNPs among the imputed SNPs.

