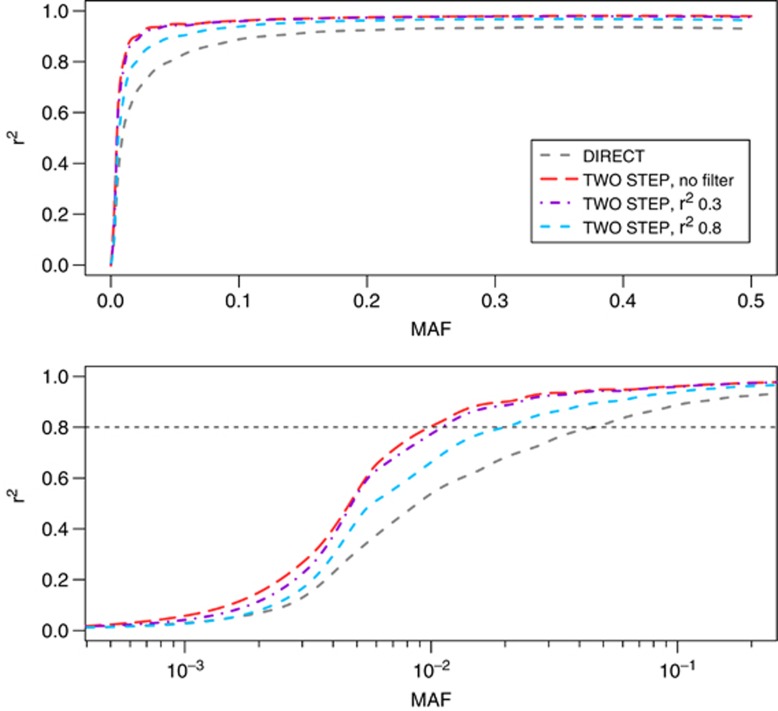
Figure 3.
Imputation quality metric, r2 per minor allele frequency (MAF) for the two different imputation strategies, chromosome 2 and 20 for the study sample. The two-step strategy further stratified by first imputation step filter. A gray horizontal dashed line at r2=0.8 is included to indicate high imputation quality. Lines were created by meaning r2 per 100 single-nucleotide polymorphisms (SNPs) and applying local polynomial regression fitting (loess function in R-project).

