FIG. 6.
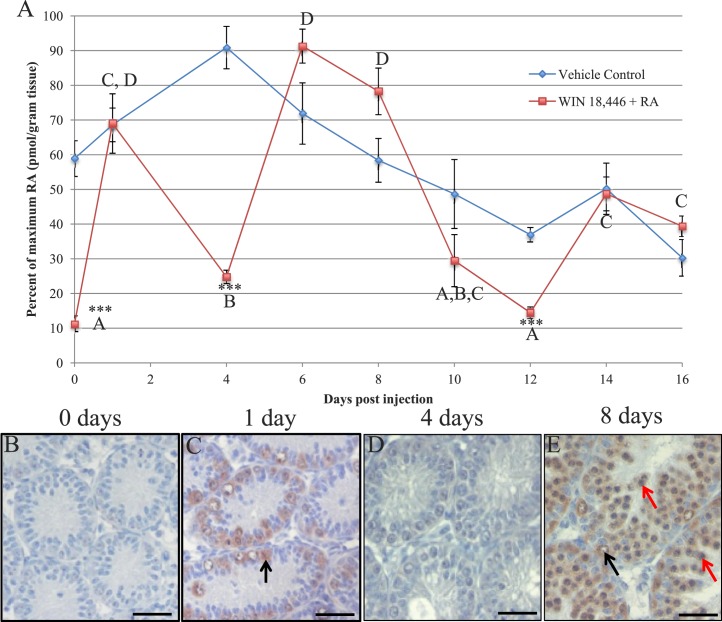
Pulses of RA can be detected in the synchronized neonatal testis. A) Graph depicts RA levels in vehicle control (blue line) and WIN 18,446/RA-treated testes (red line) over the course of the first two waves of synchronized spermatogenesis. The treated animals received either an injection of vehicle control (control samples) or RA (WIN 18,446/RA-treated samples) at time zero. Percent of maximum RA level is given on the Y axis and has been plotted against days postinjection on the X axis. Student t-tests were performed to compare treated to vehicle control samples at each time point (asterisks) and to compare only the treated samples between time points (letters). Asterisks (***) denote a significant difference (P < 0.001) between treated and vehicle control samples. Time points marked with different letters indicated statistically different (P < 0.05) RA levels between samples from the WIN 18,446/RA-treated animals. B–E). Pictures depicting STRA8 localization in cross-sections of testes collected from WIN 18,446 only-treated animals (B) and from animals allowed either 1 day (C), 4 days (D), or 8 days (E) of recovery following WIN 18,446/RA treatment. Black arrows denote STRA8-positive spermatogonia, and red arrows denote STRA8-positive preleptotene spermatocytes. Bars = 20 μm.

