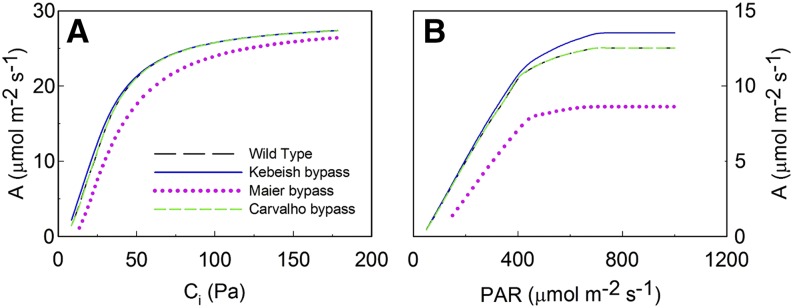
Figure 2.

Simulated CO2 response curves (A; where A = photosynthetic CO2 uptake rate) under saturating light conditions (photosynthetically active radiation [PAR] = 1,000 μmol m−2 s−1) and light response curves (B) under ambient CO2 conditions (Ci = 27 Pa; 9 µm in the liquid phase) for wild-type and bypass plants.
