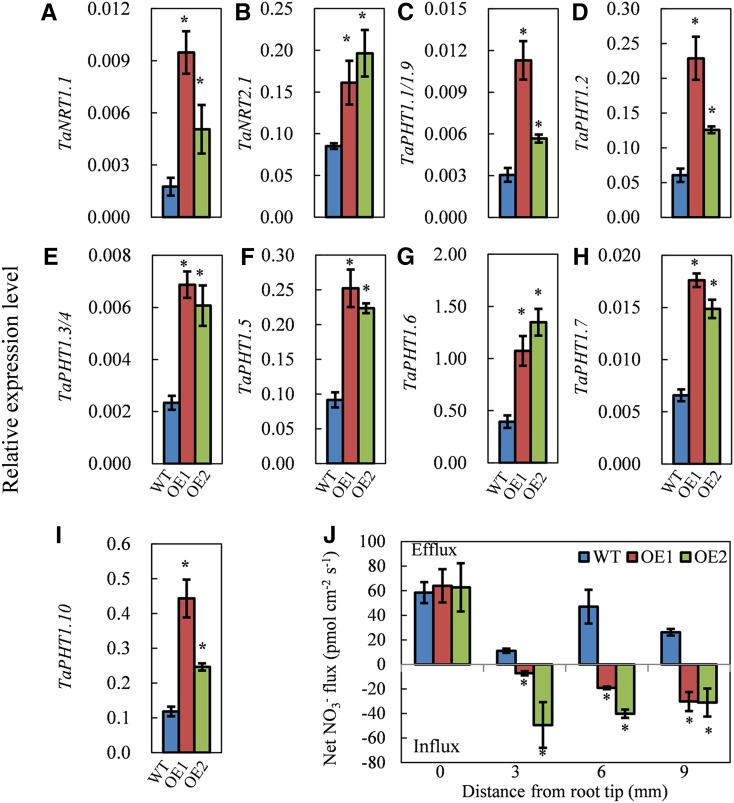
Figure 6.
Expression levels of nitrate and phosphate transporter genes in the wild type (WT) and the transgenic lines (OE1 and OE2). Wheat seedlings were grown for 20 d in the control nutrient solution, and then total RNA was isolated from the roots and used for gene expression analysis. A to I, Expressions levels of TaNRT1.1 (A), TaNRT2.1 (B), TaPHT1.1/1.9 (C), TaPHT1.2 (D), TaPHT1.3/4 (E), TaPHT1.5 (F), TaPHT1.6 (G), TaPHT1.7 (H), and TaPHT1.10 (I). J, Net NO3− flux rate. NO3− fluxes were measured by SIET with 0.2 mm NO3− in the measuring solution. Positive and negative flux values indicate efflux and influx, respectively. Data represent means ± se of at least three replicates. Asterisks indicate that differences between the wild type and the transgenic lines were significant at the 0.05 level.

