Figure 3.
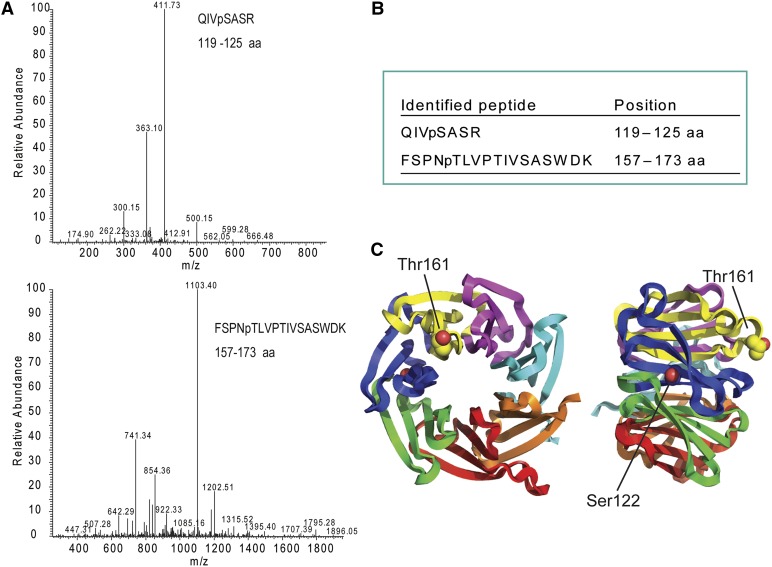
RACK1 phosphorylation sites. A, Liquid chromatography-tandem mass spectometry (LC-MS/MS) spectra of phosphorylated peptides of RACK1C. GST-RACK1C protein was phosphorylated by WNK8 and digested with trypsin. The digested sample was supplied to LC-MS/MS analysis. Peaks corresponding to phosphorylated RACK1 peptide were obtained from MS/MS analysis. B, Phosphorylated peptides identified by MS. RACK1C phosphorylated by WNK8 was used for MS analysis. Amino acid sequences and positions of two phosphorylated peptides are shown. pS, Phosphorylated Ser; pT, phosphorylated Thr. C, Phosphorylation sites on Arabidopsis RACK1A structure (Protein Data Bank ID code 3DM0; Ullah et al., 2008). Each WD40 repeat is drawn with different colors. Two phosphorylation sites identified by MS are drawn with space fill model. Note that Thr-162 of RACK1A corresponds to Thr-161 of RACK1C.

