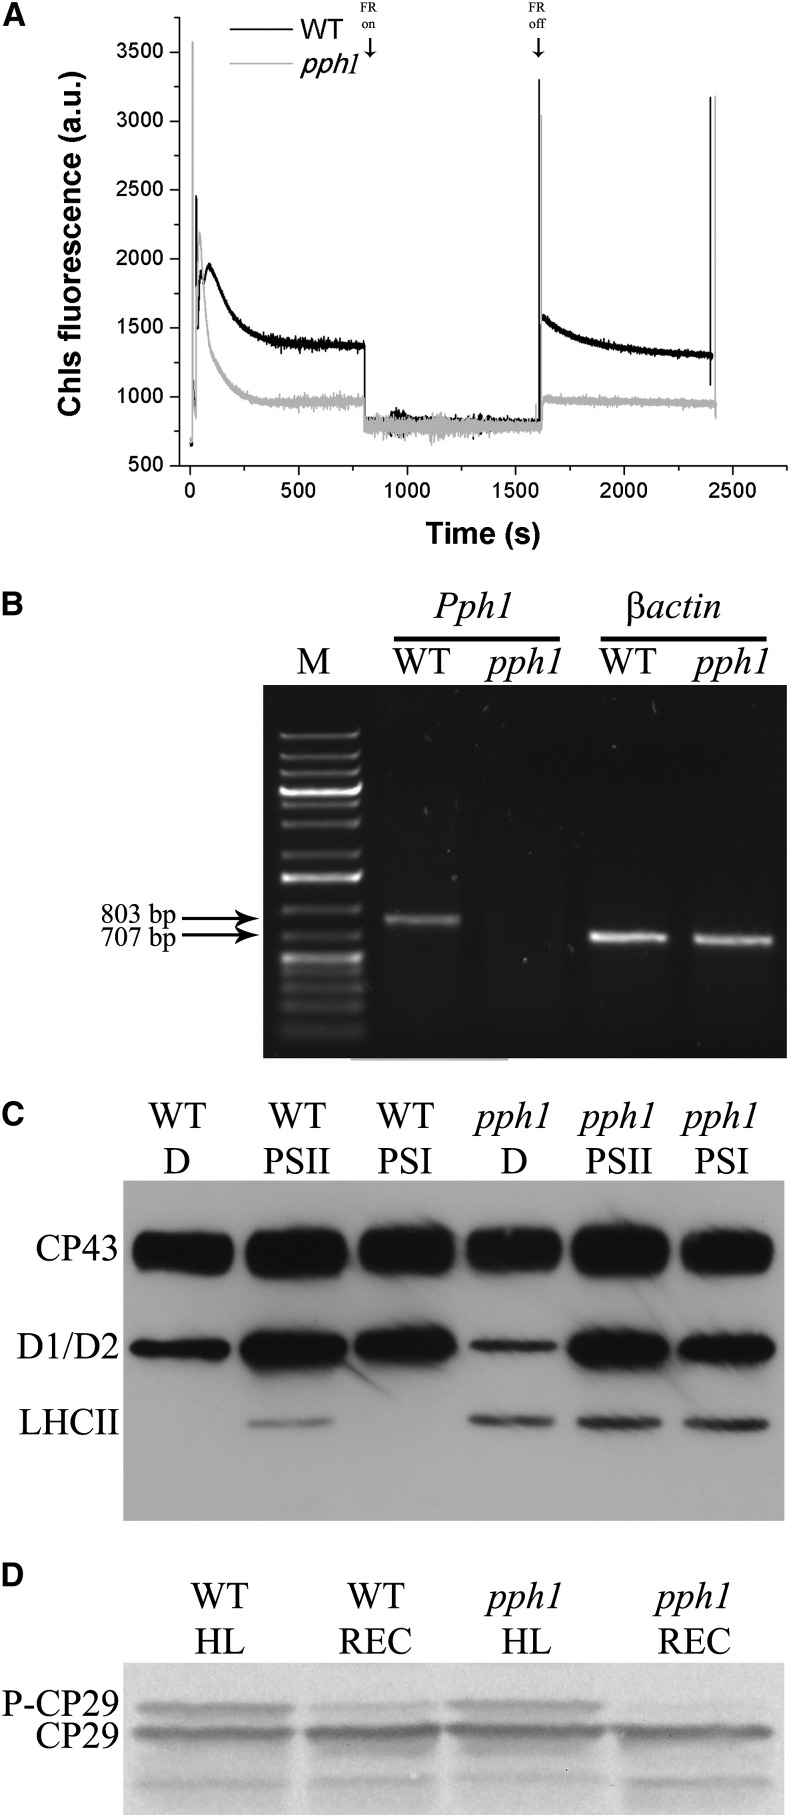
Figure 3.
Isolation and characterization of rice pph1/tap38 mutant. A, Analysis of state transition in pph1 mutant. Chlorophyll fluorescence emission was measured upon treatment with blue light and blue light supplemented with far-red (FR) light, which induce transition to State 2 and State 1, respectively. a.u., Arbitrary unit. B. RT-PCR measurement of gene-specific transcripts. Sequences of the oligonucleotides used are reported in “Materials and Methods.” The expected sizes of the PCR products are as follows: Pph1, 803 bp, and βactin, 707 bp. M indicates molecular mass marker (1-kb Plus Ladder, Thermo Scientific). C, Analysis of thylakoid phosphoproteins using anti P-Thr (Cell Signaling) antibody. Rice wild-type (WT) and pph1 mutant leaves were either dark adapted (D) or treated with PSII-specific light (PSII; 50 µmol photons m–2 s–1, 1 h, orange filter) or PSII-specific light followed by far-red illumination (PSI; 30 min), and then thylakoids have been collected (Suorsa et al., 2004). Tris-Gly SDS-PAGE 15% plus Urea 3M; 0.75 µg of Chl per lane. D, Evaluation of rice pph1 mutant capacity to dephosphorylate P-CP29 upon dark incubation. Wild-type and pph1 rice leaves, before thylakoid isolation, were illuminated (1,000 µmol photons m–2 s–1, 30 min) and then dark incubated for P-CP29 dephosphorylation (30 min) and loaded on SDS-PAGE. Immunoblot analysis as in Figure 1A. One microgram of Chl per lane.

