
Figure 2.
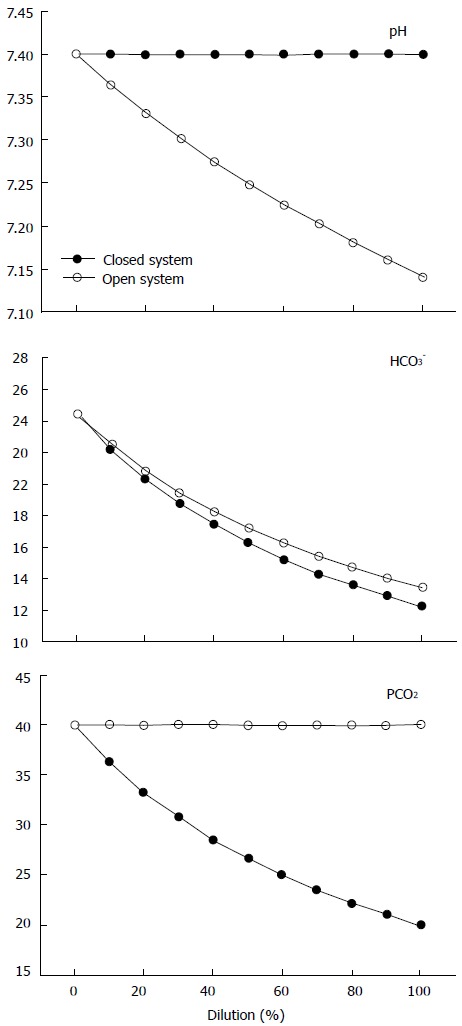
Behavior of pH (top), HCO3- (middle) and PCO2 (bottom) in a closed system (black dots) and in an open system with a PCO2 of 40 mmHg (withe dots), during stepwise dilution with 0.9% NaCl, as modified from Gattinoni et al[32].
Official websites use .gov
A
.gov website belongs to an official
government organization in the United States.
Secure .gov websites use HTTPS
A lock (
) or https:// means you've safely
connected to the .gov website. Share sensitive
information only on official, secure websites.
Behavior of pH (top), HCO3- (middle) and PCO2 (bottom) in a closed system (black dots) and in an open system with a PCO2 of 40 mmHg (withe dots), during stepwise dilution with 0.9% NaCl, as modified from Gattinoni et al[32].