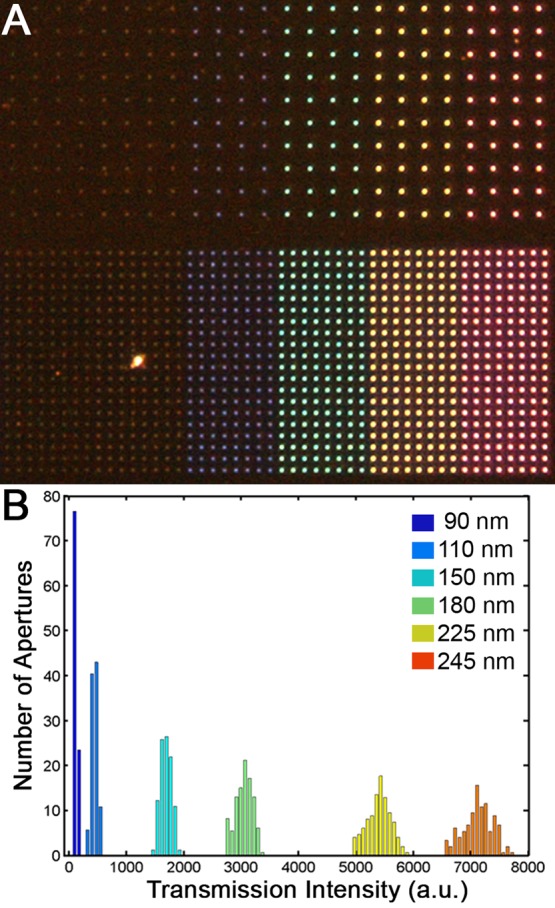
Figure 3.

Far-field images of the transmission of white light through apertures reveal the variation in transmission intensity as dependent on aperture diameter and light wavelength. (A) Color micrographs reveal brighter and redder transmission through largest apertures (right, 245 nm diameter) vs smallest apertures (left, 90 nm diameter). Apertures are spaced 10 μm apart (top) or 5 μm apart (bottom) in this field of view. An image such as this enables the detection of pinholes. (B) The quantification of total transmission intensity from each aperture reveals a narrow distributions for each size aperture, with standard deviations 3% of the average intensity.
