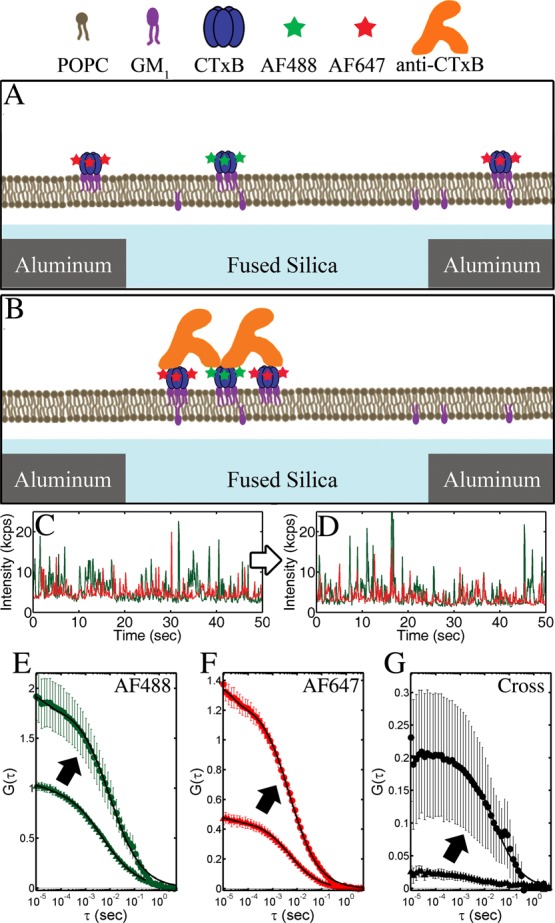
Figure 5.

Cross-linking of CTxB-AF488 (A) and CTxB-AF647 (B) by a CTxB-specific antibody on a model membrane represented schematically and observed through changes to the (C, D) I vs t, (E, F) autocorrelations, and (G) cross-correlations. (C–F) Data from AF488 and AF647 are depicted as green and red, respectively. (A, C) CTxB initially diffused independently, but (B, D) the addition of anti-CTxB results in the formation of larger, slower, multicolored clusters of CTxB. Cross-linking resulted in an increase in G0 and τD of the (E, F) autocorrelations and (G) cross-correlation. Correlations before cross-linking are indicated with a triangle (▲) and after cross-linking are indicated with a circle (●), as shown by arrows. Fits of eq 7 to the correlations are shown in solid black lines. Error bars are the standard error of the mean of 10 sequential 30 s FCCS measurements.
