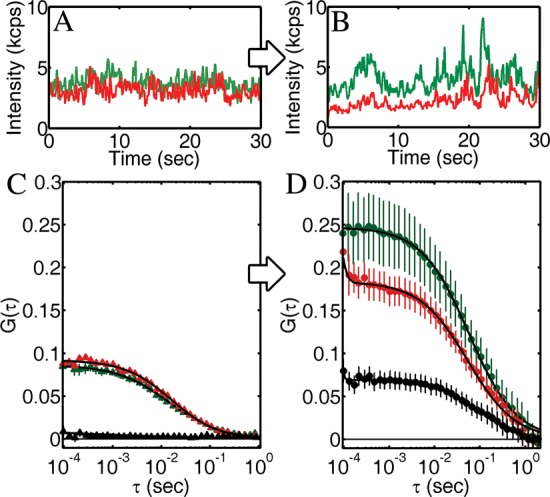
Figure 6.

Cross-linking of IgE-FcεRI by a trivalent antigen on the plasma membrane of living mast cells was observed through changes in the auto- and cross-correlations. (A) I vs t before cross-linking shows many small, uncorrelated peaks. (B) After cross-linking, I vs t for the two color channels shows correlated peaks. These results were quantified in the auto- and cross-correlations (C) before and (D) after cross-linking. Before cross-linking, autocorrelations for IgE-A488 and IgE-A647 were clear, while the cross-correlation was not. After cross-linking for 10 min with 4.2 nM Y16-DNP3, G0 and τD for both the auto- and cross-correlations increased. All correlations were fit to eq 7, and error bars are the standard error of the mean of four sequential measurements.
