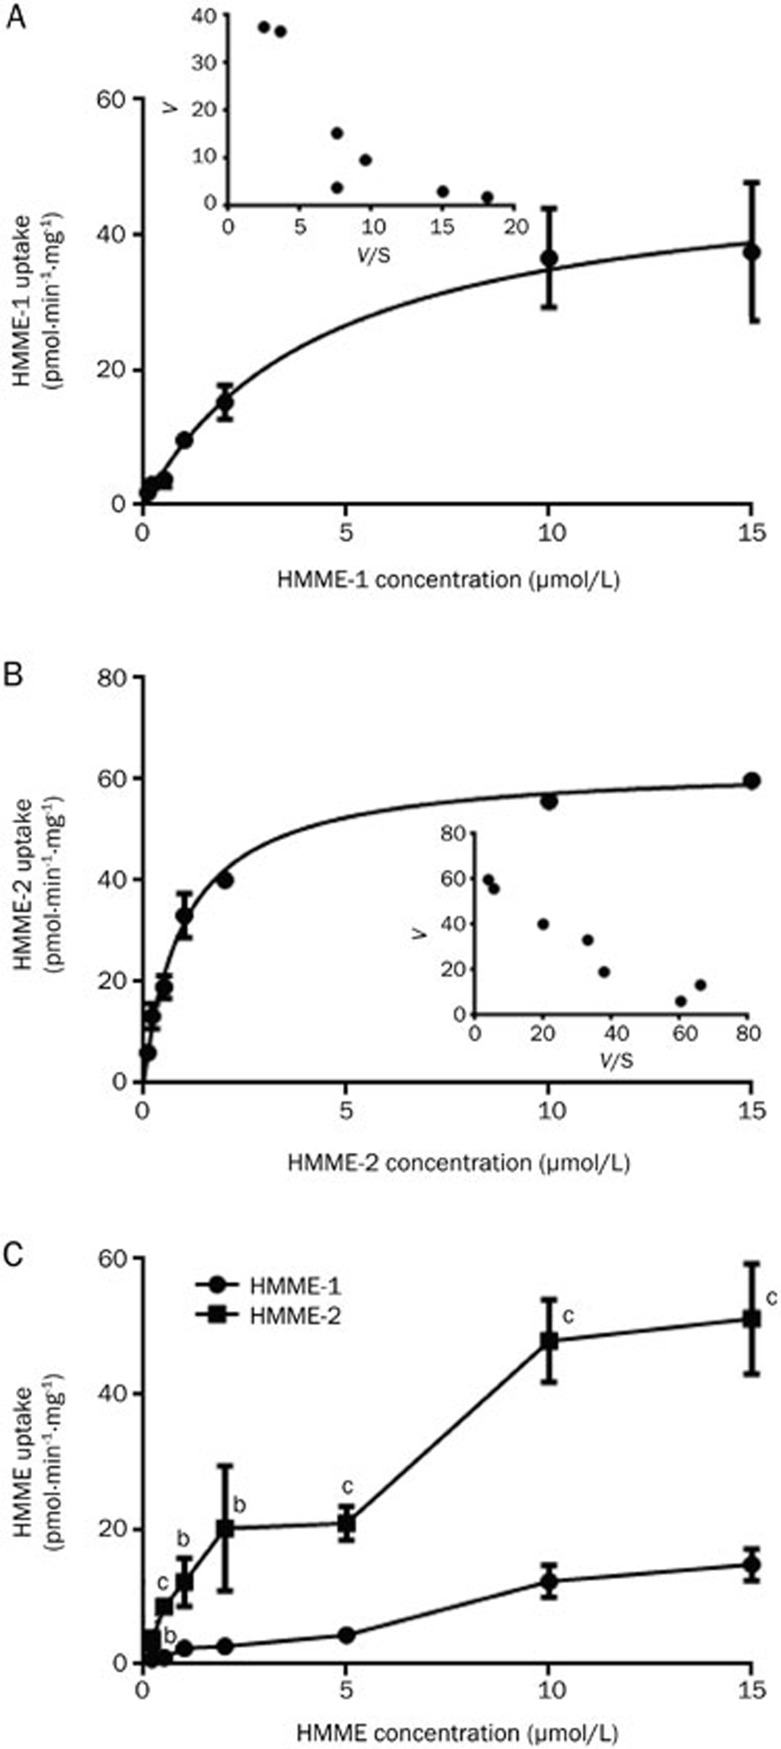
Figure 9.
Concentration-dependent uptake of HMME-1 (A), HMME-2 (B), and HMME (C) into human hepatocytes. The uptake time was 1 min. (A, B) The concentration dependence of the uptake of a single HMME isomer was represented by a nonlinear fitting curve and Eadie–Hofstee plots. (C) The accumulation of HMME-1 (circles) and HMME-2 (squares) in the hepatocytes were determined by exposing HMME to hepatocytes. Transporter-mediated HMME accumulation was corrected by subtracting the nonspecific accumulation in human hepatocytes at 4 °C from that at 37 °C. Mean±SD. n=3. bP<0.05, cP<0.01 versus HMME-1 values.

