
Figure 7.
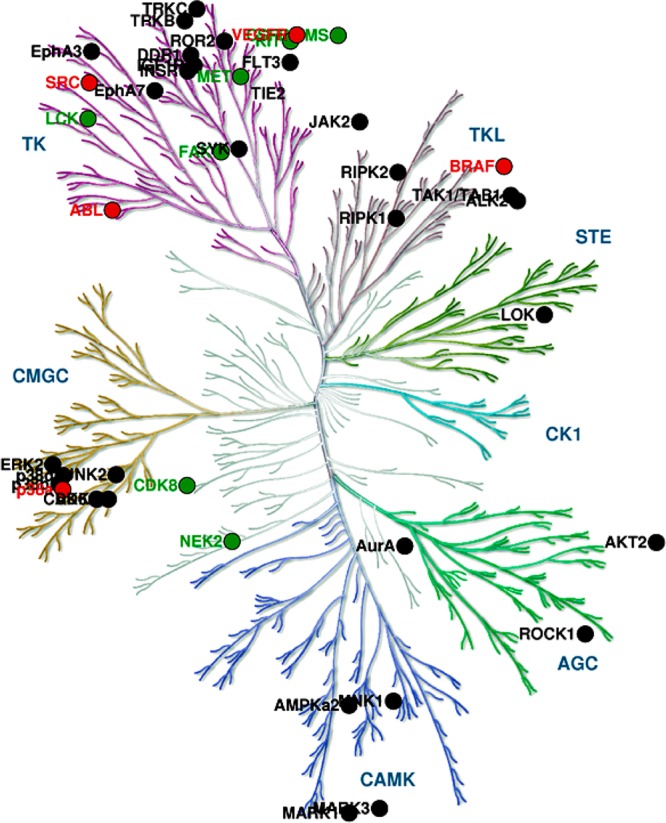
Kinome wide distribution of “classical DFG-out” conformation mapped onto the human kinome phylogenetic tree. Image was generated using KinomeRender.34 Kinase groups are abbreviated according to Manning et al.1 Color coding employed for each kinase subfamily signifies the number of structures each subfamily had in PDB: red, >10; green, >5 and <10. Black signifies <5. Illustration was reproduced courtesy of Cell Signaling Technology, Inc. (www.cellsignal.com).