
Figure 8.
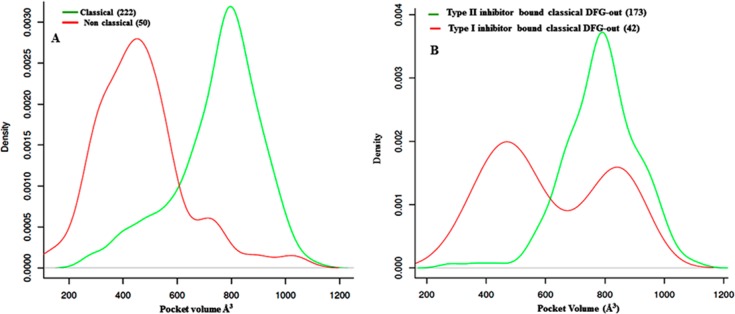
(A) Distribution profile of the pocket volume of classical and nonclassical DFG-out kinases. (B) Distribution profile of the pocket volume of “classical DFG-out” kinase conformations when complexed to type I and type II inhibitors. The number of structures of each type is indicated.