
Figure 9.
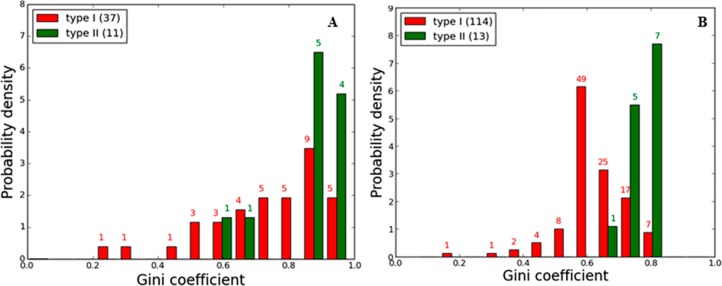
(A) Distribution profile of the Gini coefficient values of type I and type II inhibitors obtained from Davis et al. data. (B) Global selectivity trends observed for type II inhibitors in relation to type I inhibitors based on the new profiling data (nine type II compounds) and our previous Anastassiadis et al.30 data set (four type II compounds). The difference between the means of the Gini coefficients for the two inhibitor classes is statistically significant (detail see Methods).