
FIGURE 3.
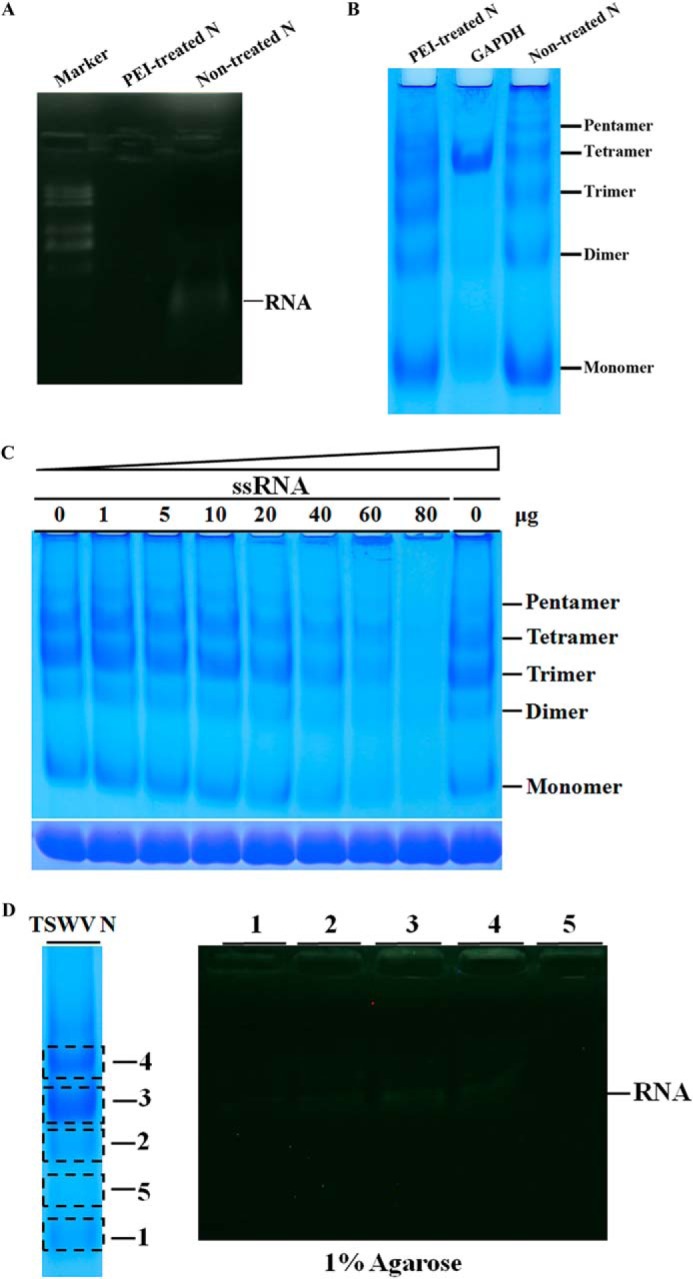
RNA binding behavior of TSWV N protein. A, gel electrophoresis analysis of cellular RNA extracted from PEI-treated N protein. The cellular RNAs were denatured and released from PEI-treated or non-treated N protein and electrophoresed on a 1% agarose gel using ethidium bromide staining. RNA is marked with an arrow. B, discontinuous blue native PAGE analysis of oligomeric formation of PEI-treated N protein. PEI-treated N protein was loaded together with a non-treated N protein in a 4–16% discontinuous blue native PAGE. GAPDH (20 μg) was used as a size marker. The positions of the monomer, dimer, trimer, tetramer, and pentamer are indicated. C, analysis of RNA binding behavior of N protein by gel mobility shift assay in a discontinuous blue native PAGE. A fixed amount of N (15 μg) was incubated with increasing amounts of unlabeled RNA transcripts with viral termini (5′UTR-GFP-3′UTR), and the complexes were resolved in a 4–16% polyacrylamide gradient gel (upper gel). The same samples were also analyzed in a 10% SDS-PAGE gel (lower gel). D, analysis of cellular RNA bound in different types of N oligomers. Purified N protein was separated in 4–16% discontinuous blue native PAGE (left panel). The bands of monomers, dimers, trimers, and tetramers (corresponding to numbers 1–4, respectively) or a region of the gel that does not contain N proteins (number 5) were precisely excised, minced, and protein in the gel was eluted with PBS. The recovered samples were denatured in RNA loading buffer containing formamide and boiled for 5 min. The cellular RNA released from N-RNA complex was analyzed in a 1% agarose by ethidium bromide staining (right panel). RNA is marked with an arrow.