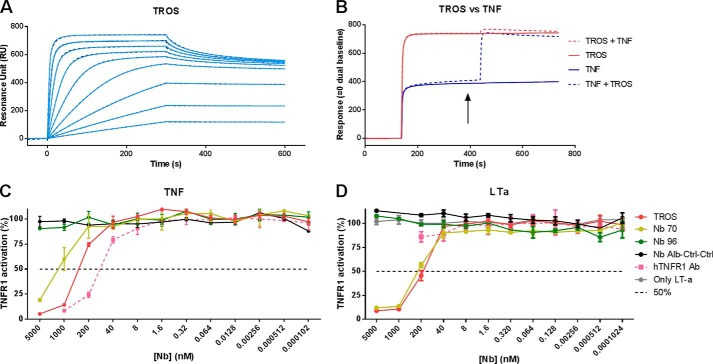
FIGURE 6.
A–D, surface plasmon resonance affinity measurement and competition studies with TROS on immobilized hTNFR1 and inhibition of TNF/TNFR1 and LTa/TNFR1 signaling in HEK-2 blue cells. A, surface plasmon resonance sensorgram of TROS on immobilized hTNFR1. The adjusted sensorgram overlays show binding of TROS applied in a dilution series ranging from 500 to 1.95 nm to immobilized hTNFR1, and dotted lines show global fitting of the binding data to a bivalent fitting model. TROS has a low KD value and therefore a high affinity. B, competition assays performed by SPR between TROS and TNF, applied in equal amounts (1 μm), show that TROS and TNF compete and therefore bind the same epitope of hTNFR1. The arrow indicates when the two components are applied together. C and D, HEK-2 blue inhibition assay with TROS and monovalent equivalents, in which cells were preincubated with a serial Nb dilution starting at 5000 nm. TROS inhibits TNF signaling through TNFR1 more strongly than the monovalent Nbs (C). TROS also inhibits LTa signaling through TNFR1, but hTNFR1 Ab does not (D). Nb Alb-Ctrl-Ctrl, an irrelevant control Nanobody; hTNFR1 Ab, a human TNFR1 antibody, positive control; 50%, Nanobody concentration by which 50% of the maximal TNFR1 activity is inhibited. Surface plasmon resonance analyses were performed in duplicate. The HEK-2 blue assays were performed in triplicate; data represent means ± S.E.

