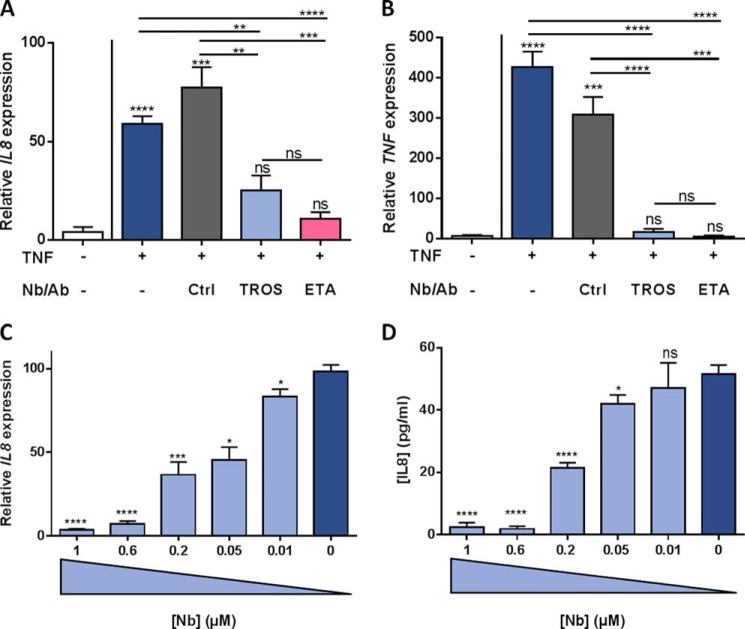
FIGURE 8.
A–D, inhibition of TNF-induced inflammation in HEK293T cells by TROS. A and B, inhibition of TNF-induced up-regulation of IL8 and TNF by TROS and ETA in HEK293T cells relative to Nb Alb-Ctrl-Ctrl. HEK293T cells were first stimulated with hTNF (1000 IU/ml) and after 30 min incubated with 1 μm TROS or ETA for 6 h. C and D, to determine the IC50 value of TROS, a dose-response experiment was performed with TROS concentrations ranging from 0.01 to 1 μm. TROS was preincubated for 30 min, and subsequently 1000 IU/ml TNF was applied. IL8 and TNF expression after 6 h was determined by qPCR, and IL8 levels in supernatant were determined with Bio-Plex after 24 h. Ctrl, Nb Alb-Ctrl-Ctrl, an irrelevant control Nanobody. *, 0.01 ≤ p < 0.05; **, 0.001 ≤ p < 0.01; ***, 0.001 ≤ p 0.0001; ****, p < 0.0001. The experiment was done in triplicate and data represent mean ± S.E. qPCR data were normalized to stable housekeeping genes.

