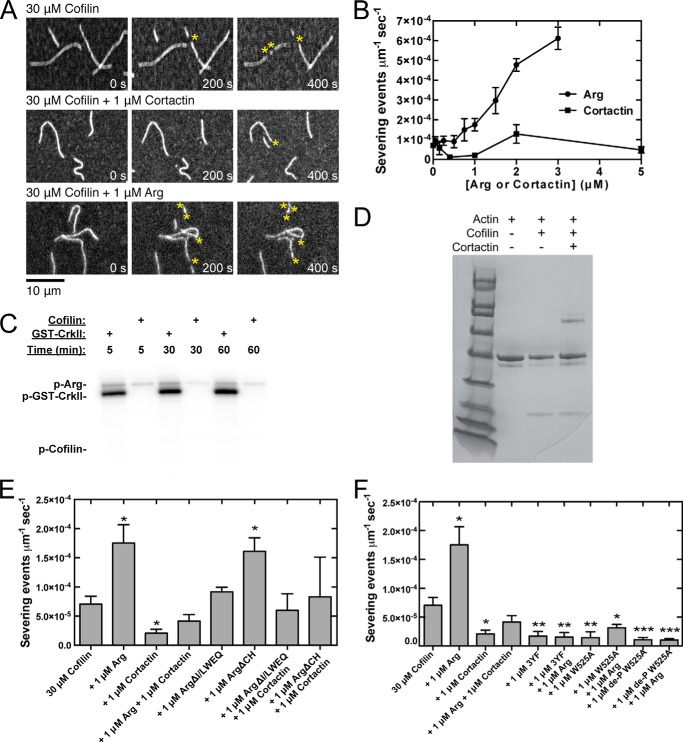
FIGURE 3.
Arg promotes severing of actin filaments by cofilin, but this activity is inhibited by cortactin. Conditions are as follows: 35 mm KCl, 0.7 mm MgCl2, 0.7 mm EGTA, 7 mm imidazole (pH 7.0), 0.5% (4000 cP) methyl cellulose, 15 mm glucose, 200 μm ATP, 50 mm DTT, 20 μg/ml catalase, 100 μg/ml glucose oxidase, 25 mm Tris-HCl (pH 8.0), 250 mm NaCl, 2.5% glycerol, 0.005% Triton X-100, 0.5 mm EDTA. Actin filaments (20% Alexa 488-labeled) were pre-assembled in the flow chamber before introducing 30 μm human cofilin and Arg or cortactin. A, time series of fluorescence micrographs of actin filament severing mediated by 30 μm cofilin, Arg, and cortactin. Concentrations of Arg and cortactin are indicated. B, dependence of cofilin severing activity on the concentration of Arg and cortactin. The units of severing activity are severing events per μm of actin filament per second. C, phosphorylation of 1 μm Crk-II and 1 μm cofilin by 50 nm Arg in 25 mm Hepes (pH 7.25), 100 mm NaCl, 1 mm DTT, 1 mm sodium orthovanadate, 5% glycerol, 5 mm MgCl2, 5 mm MnCl2, 5 μm ATP, 0.75 μCi of [γ-32P]ATP over 5, 30, and 60 min. D, pelleting assay. Actin filaments (2 μm) were incubated with either 50 μm cofilin or 1 μm cortactin or both and centrifuged at 100,000 × g for 1 h. Pellet samples were analyzed by SDS-PAGE and stained with Coomassie Blue. The intensities of the cofilin and actin bands were quantified with ImageJ. E and F, cofilin severing activity measured in the presence of wild type and mutant Arg constructs and wild type and mutant cortactin. Error bars are the standard error of the mean for a minimum of three regions of each acquired time period. Asterisks represent a statistically significant difference in comparison with the control of 30 μm human cofilin. *, p < 0.05; **, p < 0.01; ***, p < 0.001.

