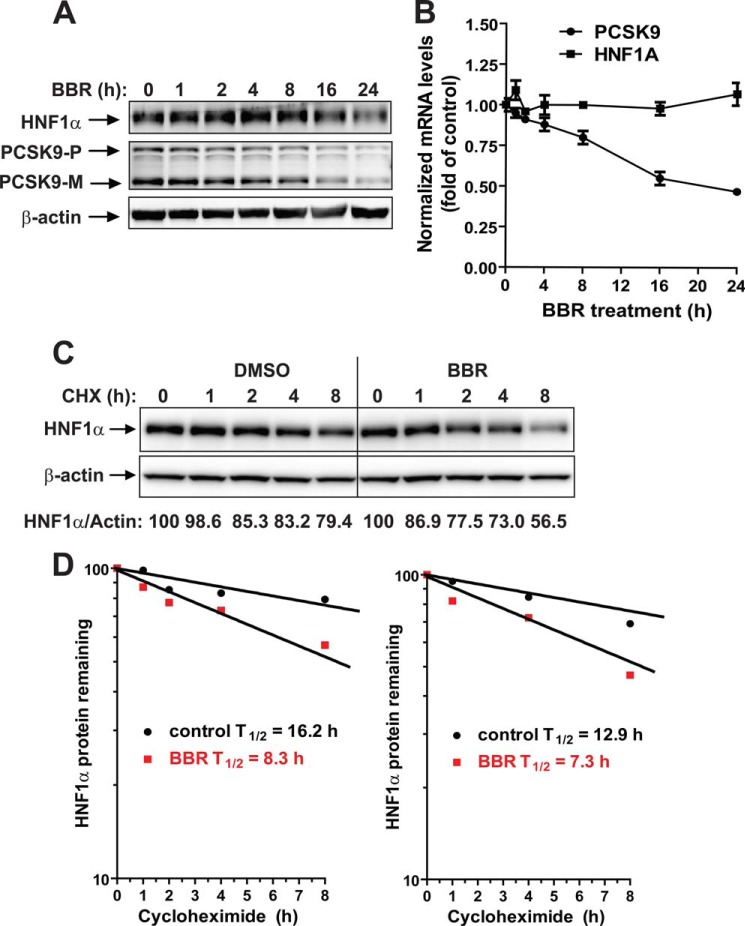
FIGURE 3.
BBR down-regulates HNF1α expression by accelerating its protein degradation in HepG2 cells. A, HepG2 cells were treated with 40 μm BBR for the indicated times. Total cell lysates were isolated from cells and analyzed for PCSK9 and HNF1α protein levels by Western blotting. The results shown are representative of three separate experiments with similar results. B, HepG2 cells were treated with 40 μm BBR for the indicated times. Total RNA was isolated, and PCSK9 and HNF1α mRNA levels were assessed by qRT-PCR using human-specific PCR primers, and triplicate measurements were conducted for each cDNA sample. The results shown are representative of three separate experiments with similar results. C, HepG2 cells were treated with CHX at a 5 μg/ml concentration at the indicated times in the absence or the presence of 40 μm BBR. Total cell lysates were subjected to Western blotting, and bands were visualized with antibody against HNF1α or β-actin. The data shown are representative of two separate experiments with similar results. D, after normalization to β-actin, the HNF1α signal intensity was plotted against the CHX treatment time to calculate the t½ of HNF1α protein. Half-life was calculated from each of the two separate experiments. Error bars, S.E.

