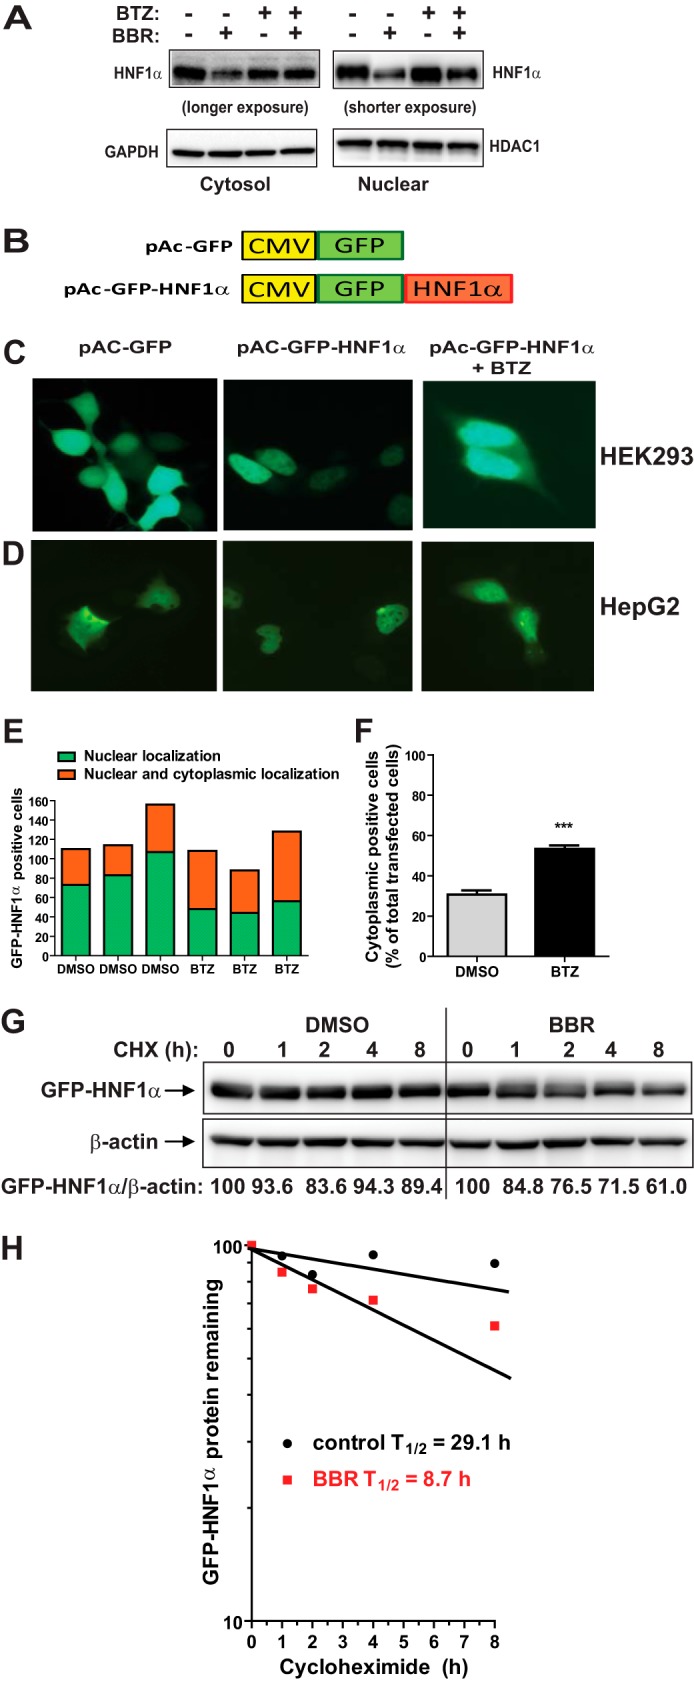
FIGURE 6.

Accumulation of HNF1α in cytoplasm by proteasome inhibition. A, HepG2 cells were treated with BBR without and with 100 nm BTZ for 24 h. Nuclear fraction and cytoplasmic fraction of total cell lysates from each sample were prepared and analyzed for HNF1α protein levels by Western blotting. The membranes were reprobed with anti-HDAC1 antibody as a control of equal nuclear protein loading or GAPDH as a control of equal cytoplasmic protein loading. The data shown are representative of two separate experiments with similar results. B, diagram of GFP and GFP-HNF1α fusion constructs. Human HNF1α coding sequence was subcloned into pAcGFP-C1 vector at the BglII and EcoRI sites to produce the N-terminal GFP-tagged fusion protein. C and D, HEK293 cells or HepG2 cells were transfected with pAc-GFP or pAc-GFP-HNF1α. Two days after transfection, cells were treated with either BTZ or DMSO for 24 h. The subcellular localization of GFP-HNF1α fusion protein was examined with a fluorescence microscope. The pictures shown are representative of three separate experiments with similar results. E, from each well, ∼80–160 GFP-HNF1α-positive HepG2 cells were examined for their subcellular localization and graphed. F, the percentage of transfected HepG2 cells with GFP-HNF1α in cytoplasm was calculated. The values are presented as mean ± S.E. (error bars) of triplicate wells per condition. G, HepG2 cells transfected with pAc-GFP-HNF1α were treated with CHX at 5 μg/ml concentration at the indicated times in the absence or the presence of 40 μm BBR. Total cell lysates were subjected to Western blotting and bands were visualized with antibody against GFP or β-actin. The data shown are representative of two separate experiments with similar results. H, after normalization to β-actin, the GFP-HNF1α signal intensity in G was plotted against the CHX treatment time to calculate t½ of GFP-HNF1α fusion protein.
