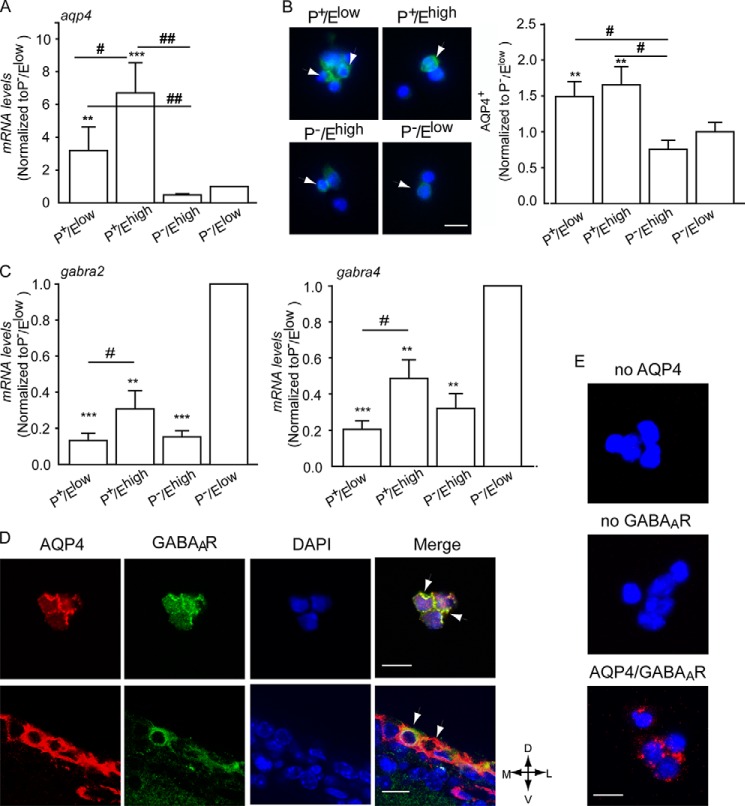
FIGURE 1.
GABAARs and AQP4 are coexpressed in close proximity to SEZ precursors. A–C, analysis of levels of Aqp4 transcripts (A), AQP4 immunoreactivity (B), and transcripts for the indicated GABAAR subunits (C) in the given sorted populations. For transcript quantification, values are the means of relative expression levels from ddCT ± S.E. normalized to P−/Elow cells. * indicates significantly different from P−/Elow cells (ANOVA), n = 4. B, left panels show representative photomicrographs of sorted nonpermeabilized cells illustrating AQP4 immunoreactivity (green) and DAPI counterstaining of the nuclei (blue). Scale bar, 10 μm. D, representative confocal photomicrographs of postnatal SEZ-dissociated cells (upper panel) and adult coronal slices (lower panel) upon double immunostaining without previous permeabilization. Scale bar, 15 μm. Arrowheads point to double immunopositive cells. D, dorsal; M, medial; L, lateral; V, ventral. E, representative photomicrographs of sorted P+ cells illustrating AQP4 and GABAAR colocalization (red) detected by PLAs upon incubation with the indicated primary antibodies and DAPI (blue) counterstaining of the nuclei. Scale bar, 15 μm.

