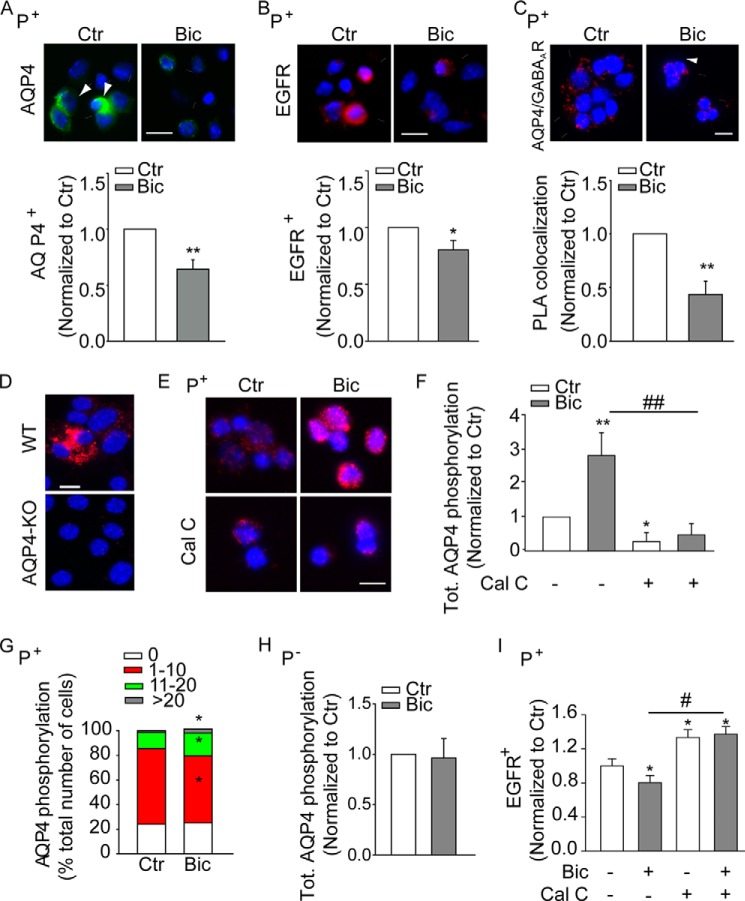
FIGURE 2.
Effect of GABAAR signaling on phospho-AQP4 and the expression of the water channel at the surface of precursors sorted from the neonatal (P7) SEZ. A and B, upper panels show representative photomicrographs illustrating AQP4 (A) and EGFR (B) immunoreactivity and colocalization of AQP4 and GABAARs detected by PLAs (C) at the surface of sorted P+ precursors. Relative quantification is shown in the lower panels. D and E, representative microphotograph illustrating AQP4 serine phosphorylation by PLAs in permeabilized neurosphere cultures derived from WT and AQP4 knock out (KO) mice (D) and sorted P+ cells (E). Immunoreactivity and colocalization are visualized in red and DAPI counterstain of the nuclei in blue. Scale bars, 15 μm (A–C) and 10 μm (D). F–H, quantitative analysis of phospho-AQP4 by PLAs in sorted P+ and P− cells as indicated. AQP4 primary antibodies were added with (F–H) and without (G) previous permeabilization to visualize total and surface phospho-AQP4, respectively. G, cells were categorized based on the number of the displayed fluorescent signals, and the effect of the treatment was quantified by calculating the number of cells in each group as percentage of the total. I, quantitative analysis of EGFR expression at the cell surface of sorted P+ cells by immunostaining. Sorted cells were exposed to bicuculline (Bic, 50 μm for 30 min) and calphostin C (Cal-C, 1 μm for 45 min) 6 h after culturing or left untreated (Ctr) as indicated. * indicates significantly different from untreated cells (ANOVA) n ≥ 3.

