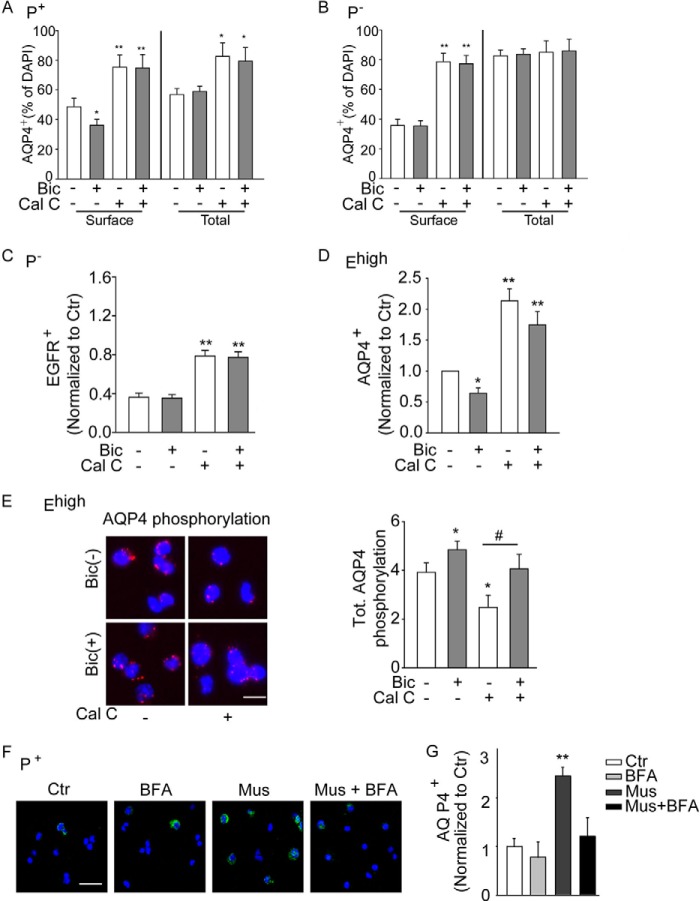
FIGURE 3.
PKC and GABAAR signaling affects AQP4 expression and its phosphorylation in precursors sorted from the neonatal (P7) SEZ based on prominin-1 or EGFR expression. A–C, effect of bicuculline (Bic, 50 μm) and calphostin C (Cal-C, 1 μm) on the expression of AQP4 (A and B) and EGFR (C) in sorted P+ and P− precursors as indicated. n ≥ 3. D, quantification of AQP4 expression at the cell surface of sorted EGFRhigh cells after treatment as indicated. n ≥ 3. E, analysis of phospho-AQP4 by PLAs in permeabilized sorted Ehigh cells. Left column panels show representative photomicrographs of the cells and right column panels relative quantifications. Red fluorescent signals reveal phospho-AQP4. Scale bar, 10 μm. Six hours after sorting, cells were exposed to bicuculline (50 μm for 30 min) in the presence or absence of Cal-C (1 μm for 45 min) or left untreated (Ctr) as indicated. F, panels show representative photomicrographs illustrating AQP4 immunoreactivity at the surface of P+ cells that after sorting had been plated for 6 h before treatment without (Ctr) or with muscimol (Mus) and/or brefeldin A (BFA) as indicated. Scale bar, 35 μm. G, quantification of the immunostaining in F. n ≥ 3. * indicates significantly different from control untreated cells (ANOVA) *, #, p < 0.05; **, p < 0.01.

