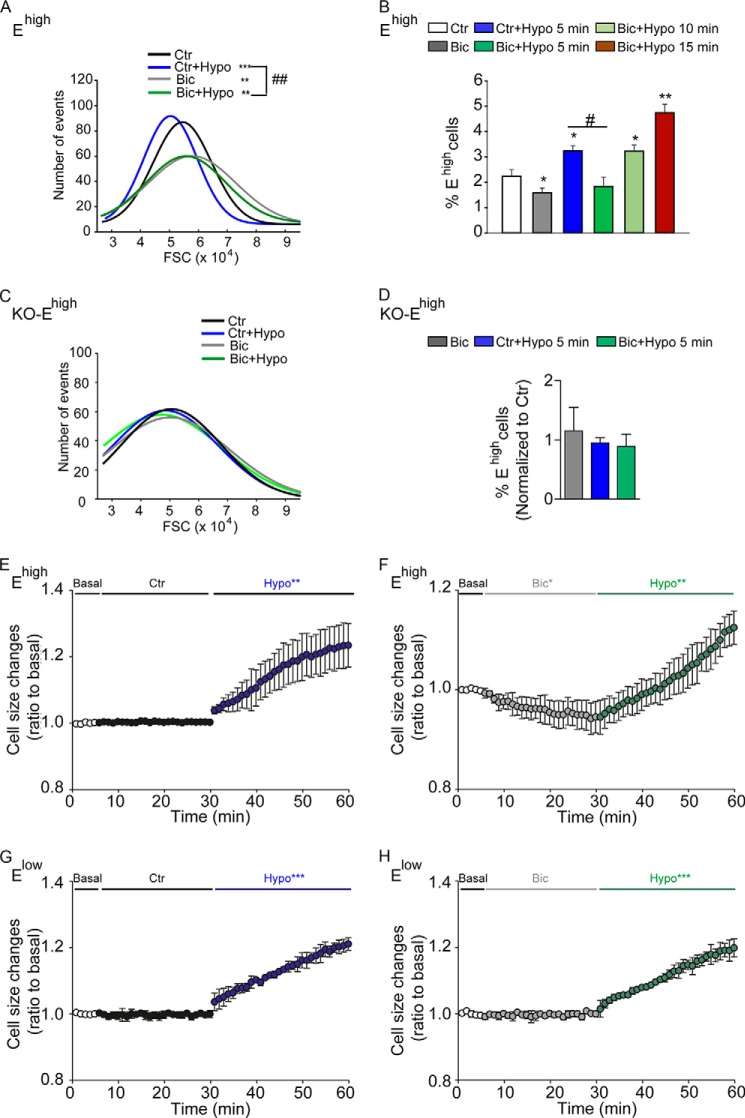
FIGURE 5.
Blockade of GABAARs delays swelling of Ehigh cells in response to osmotic challenge. A and D, effect of GABAARs on the response to osmotic challenge of dissociated cells derived from the neonatal SEZ of neonatal WT (A and B) and AQP4 KO (C and D) mice. Representative FACS histograms illustrating the frequency distribution of forward side scattering (FSC) values of Ehigh cells are shown in B and C, quantification of the number of Ehigh cells upon the indicated treatments are given in B and D. Curves were fitted by single Gaussian functions whose mean, S.D., and adjusted R-squared values were calculated. FSC was analyzed on freshly dissociated cells that had been treated with (Bic) or without (Ctr) bicuculline during dissection and staining for 30 min. Five minutes before FACS analysis, hypo-osmotic solution (with the final osmolarity of 200 mosm/kg) was added to the control (Ctr+Hypo) and bicuculline (Bic+Hypo) group as indicated. * indicates significantly different from control (ANOVA); **,##, p < 0.01; ***, p < 0.001, ANOVA; n ≥ 4–5. E–H, effect of GABAARs on the response to osmotic challenge of neonatal Ehigh (E and F) and Elow (G and H) cells that after sorting were cultured in NBA medium for 2 days before loading with calcein-AM (1 μm) and live imaging. Cells were exposed to bicuculline (50 μm) or left untreated as control (Ctr) and were recorded for 25 min as indicated. Thereafter, hypo-osmotic solution (Hypo, 200 mosm/kg) supplemented with or without bicuculline (50 μm) was added, and cells were recorded for an additional 30 min. Changes in cell size are represented as mean ± S.D. n ≥ 3. *, p < 0.05; **, p < 0.01; ***, p < 0.001. Values of the mean curve obtained in basal and treatment (Ctr-Hypo, Bic-Hypo) conditions were averaged every 60 s and analyzed by two-tailed Student's t test.

