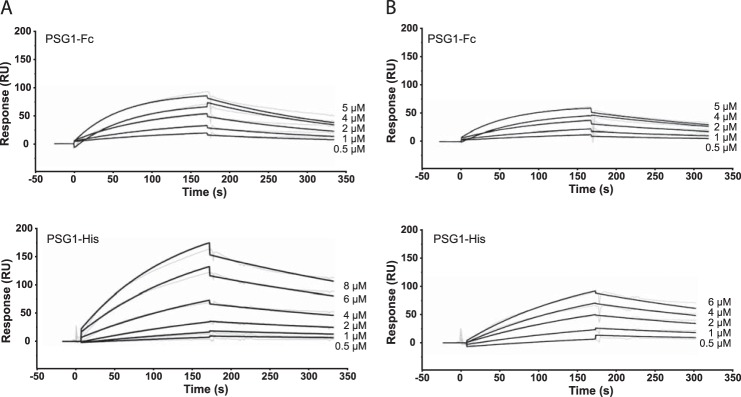
FIGURE 2.

PSG1 interacts with SLC and LAP of TGF-β1. Shown are the results from SPR analysis of the interaction of PSG1-Fc and PSG1-His with SLC (A) or LAP (B) of TGF-β1. A protein concentration that ranged from 8 to 0.5 μm was analyzed across blank, SLC, and LAP biosensor surfaces. The data were analyzed using a simultaneous fit algorithm to calculate the kinetic parameters presented in Table 1. Representative SPR sensorgrams for each response are shown as gray lines, and fit analyses are shown as black lines. RU, response units.
