
Figure 1.
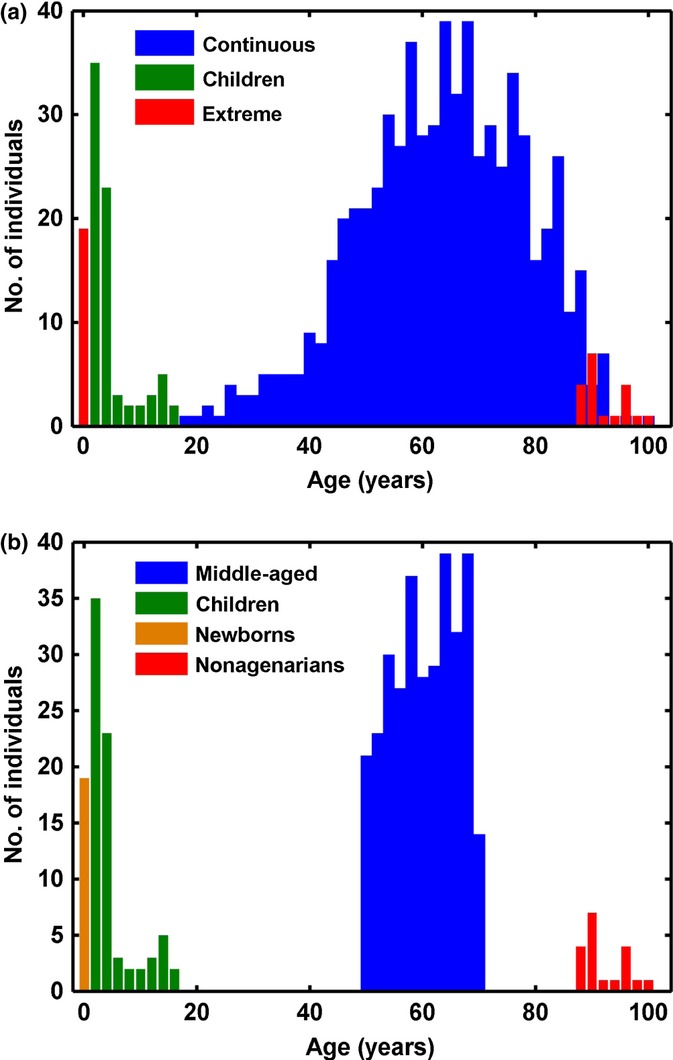
Age distribution of data used in the DMR analysis (a) and the VMR analysis (b). The children data set is in green n = 78 (Alisch et al., 2012), and the extreme (Heyn et al., 2012b) data set is in red in (a) n = 38. In (b), the data set is divided into newborns in yellow n = 19 and nonagenarians in red n = 19. The continuous (Hannum et al., 2013) data set is in blue n = 656 in (a). It is restricted to individuals between 50 and 70 years old in (b) (n = 319) and named ‘middle-aged’.