
Figure 1.
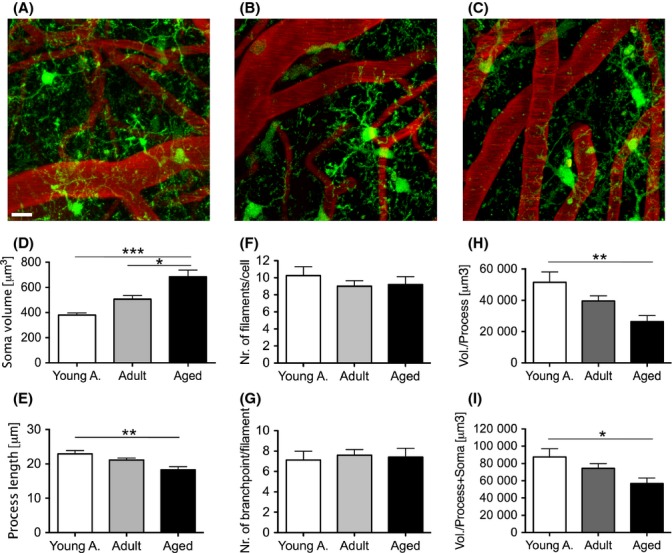
Age-related changes in microglia morphology assessed by in vivo imaging. Young adult (3 months), adult (11–12 months), and aged (26–27 months) Iba-1-EGFP transgenic mice (5 animals/group) received cranial window surgery and were imaged using 2-photon microscopy. (A–C) Representative maximum z-projection of imaged neocortical volumes of a young adult (A), adult (B), and aged (C) animal. Microglia express EGFP (green) and blood vessels were labeled by i.v. injection of Texas Red dextran (red). Scale bar is 10 μm. (D–I) Quantitative morphological changes of microglia were assessed using 3D in vivo data. Soma volume (D) was calculated by surface reconstruction (at least 15 cells were analyzed per mouse). A significant increase in soma volume with age was found (one-way ANOVA, F2,12 = 17.56, P = 0.0003; Tukey’s multiple comparison * P < 0.05, *** P < 0.001; 95% confidence interval (CI) young adult = 332.2–426.7; adult = 422.9–587.4; aged = 536.3–830.7). Process length (E), calculated for the longest primary filaments originating from the microglia soma (at least 100 processes were analyzed per animal) revealed an age-related reduction (one-way ANOVA, F2,12 = 7.553, P = 0.075; Tukey’s multiple comparison ** P < 0.01; 95%CI young adult = 20.75–25.65; adult = 9.40–22.76; aged = 15.74–20.80). The complexity of processes was assessed by measuring the total number of primary filaments per cell (F) and the number of branchpoints per primary filament (G). Both measures did not show any significant age-related changes (at least 100 processes were analyzed per animal; one-way ANOVA F2,12 = 0.58 and F2,12 = 0.09, P > 0.05). As both the primary filament length and the soma volume change with age, the overall change in brain volume covered by either just the processes (H) or the soma and the processes (I) was calculated. The processes showed a significant reduction in volume coverage with age (one-way ANOVA, F2,12 = 6.826, P = 0.001; Tukey’s multiple comparison ** P < 0.01; 95%CI young adult = 33172–69830, adult = 30671–48584, aged = 15244–37359). The combination of soma radius and process length showed a reduction in volume coverage per cell (one-way ANOVA, F2,12 = 4.452, P = 0.035; Tukey’s multiple comparison * P < 0.05; 95%CI young a = 61493–113440, adult = 58925–89754, aged = 38975–74623). Error bars indicate SEM.