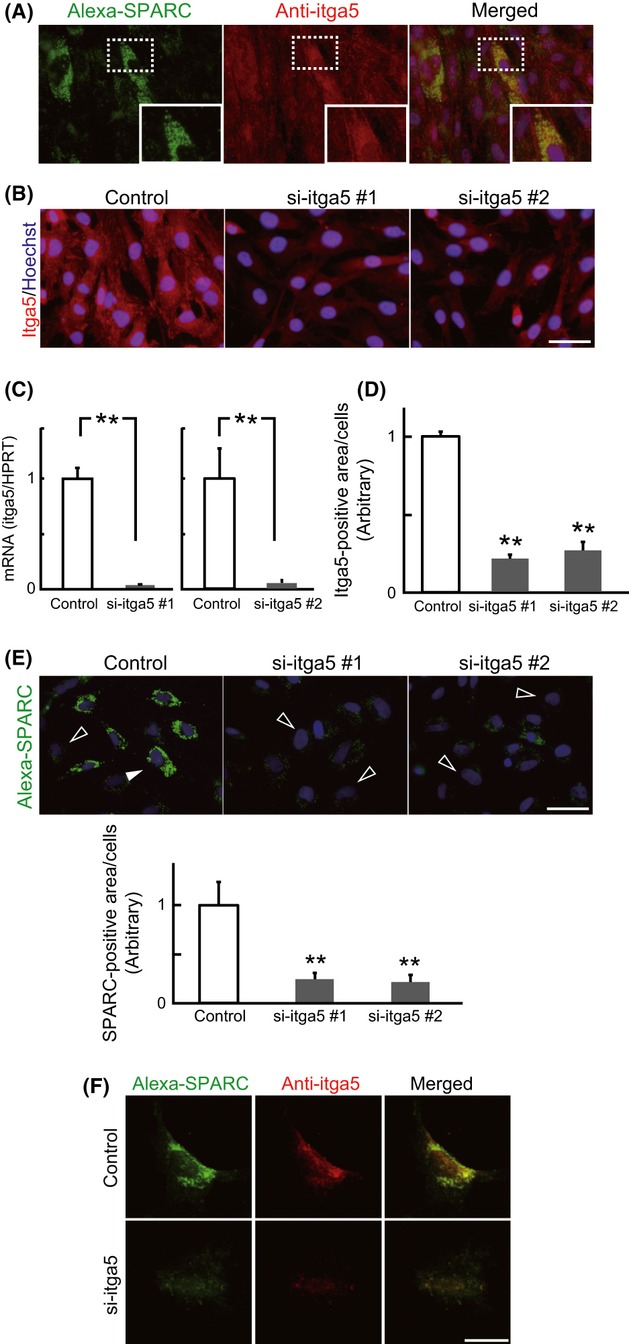
Figure 2.

Integrin-α5-dependent internalization of SPARC. (A) Skm-PCs from young rats were incubated with Alexa-SPARC (green) and immunostained with anti-itga5 antibody (red). Insets of structures in the dash-lined boxes are shown enlarged in the bottom right corners. Nuclei were visualized with Hoechst 33258 dye (blue). (B) Representative images of itga5-targeted siRNA (si-itga5) in Skm-PCs 2 days after transfection. Scale bar = 50 μm. (C) si-itga5 silencing efficiency was evaluated by qPCR in Skm-PCs from young rats 2 days after siRNA transfection. Data are expressed as the means ± SEM (n = 3). **, P < 0.01 vs. control. (D) si-itga5 silencing efficiency was evaluated by immunostaining in Skm-PCs from young rats 2 days after siRNA transfection. Data are expressed as the means ± SEM (n = 3). **, P < 0.01 (Dunnett’s test). (E) SPARC fluorescence per cell was quantified by ImageJ and compared between control and si-itga5 groups. Black arrowheads indicate weakly and white arrowheads indicate strongly SPARC-internalizing cells, respectively. Scale bar = 50 μm. Error bars represent means ± SEM (n = 10 cells). **, P < 0.01 (Dunnett’s test). (F) Confocal images of Skm-PCs from young rats incubated with Alexa-SPARC and immunostained with anti-itga5 antibody 2 days after si-itga5 transfection. Scale bar = 20 μm. Skm-PCs, skeletal muscle progenitor cells; SPARC, secreted protein acidic and rich in cysteine.
