
Figure 1.
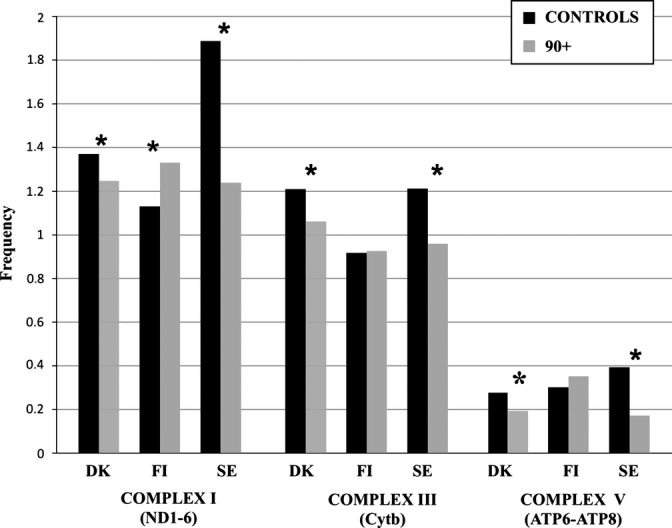
Nonsynonymous mutation frequencies in 90+ and controls in mtDNA genes of OXPHOS complexes I, III and V, which showed a significant association with longevity after sequence analysis for pooled associations (Table 2). * indicates statistical significant differences between 90+ and controls. Frequency (y-axis) indicates the average number of mutation per subject every 100 bp of the relevant mtDNA region. DK, FI, and SE stand for Denmark, Finland, and South Europe populations, respectively.