
Figure 1.
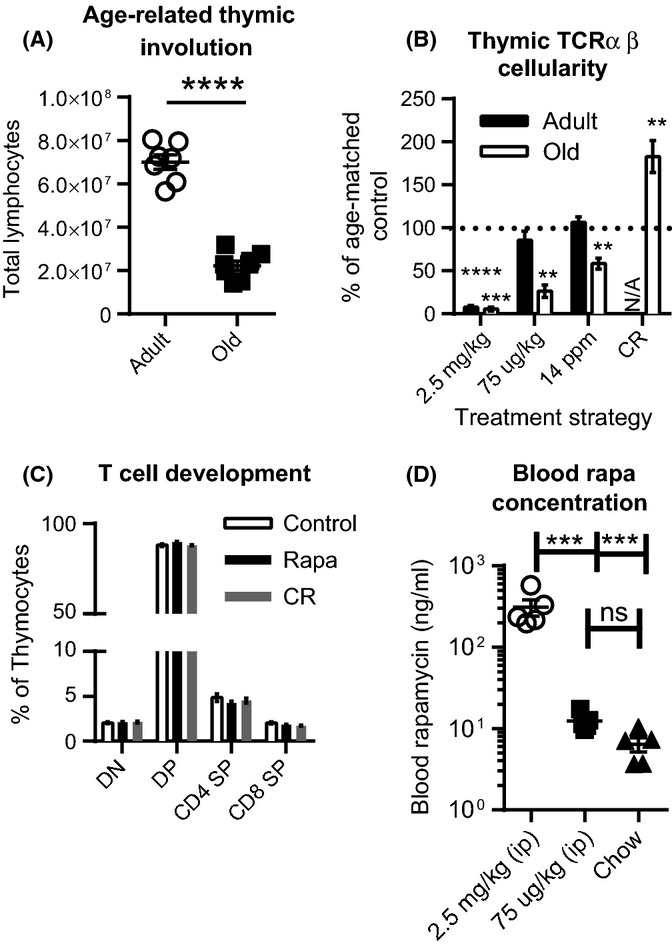
Rapamycin and calorie restriction have different effects on thymic cellularity. Mice were placed on rapa for 2 months or on CR for life. (A) Untreated A and O mouse thymus cellularity. (B) Thymi were harvested from A and O mice from the indicated treatment groups and total thymocytes enumerated. (C) Thymus single-cell suspensions were analyzed for thymocyte development based on CD4 and CD8 expression. (D) Whole blood rapa concentration was measured in O mice being treated with the indicated doses and routes. Data represent the combination of 2 independent experiments, with n = 2–5 mice per replicate. (B) Thymic cellularity is represented as % of age-matched controls that were harvested at the same time, to control for different dosing routes. 2.5 mg kg−1 and 75 μg kg−1 were given as daily i.p. injections. 14 ppm was the concentration of rapa in rodent chow, as described in the experimental procedures section. Statistical differences were calculated by Student's t-tests compared to the cellularity of age-matched, control-treated mice. (C-D) Statistical differences were calculated by 1-way ANOVA with Bonferroni's post-tests. *P<0.05; **P<0.01; ***P<0.001.