
Figure 2.
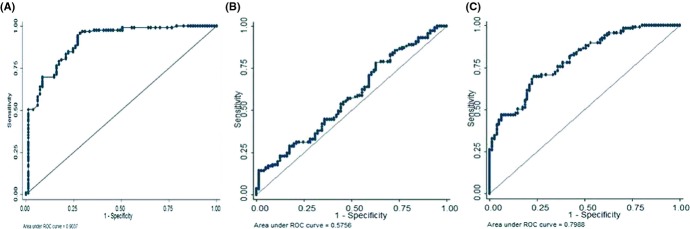
ROC analysis showing the area under curve for SIRT1(A), SIRT2(B), and SIRT3(C) to distinguish frail from nonfrail subjects.
Official websites use .gov
A
.gov website belongs to an official
government organization in the United States.
Secure .gov websites use HTTPS
A lock (
) or https:// means you've safely
connected to the .gov website. Share sensitive
information only on official, secure websites.
ROC analysis showing the area under curve for SIRT1(A), SIRT2(B), and SIRT3(C) to distinguish frail from nonfrail subjects.