
Figure 4.
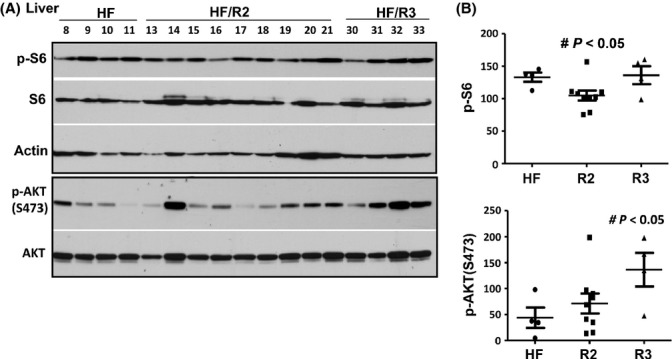
p-S6 and p-Akt in the liver of survived mice. (A). Immunoblot analysis of protein lysates from the liver of ~ 2-year-old male mice on high-fat (HF) diet: control (HF – untreated) or rapamycin treated (groups R2 and R3 presented – HF/R2, HF/R3). Numbers indicate individual mice. Equal loading was also confirmed by staining the membrane with Commassie Blue (Fig. S3, Supporting information). (B). Quantitative analysis of data shown in Fig. 4A. Quantified intensities of p-S6 signal and signal of p-AKT(Ser473) presented as mean ± SE.