
Figure 2.
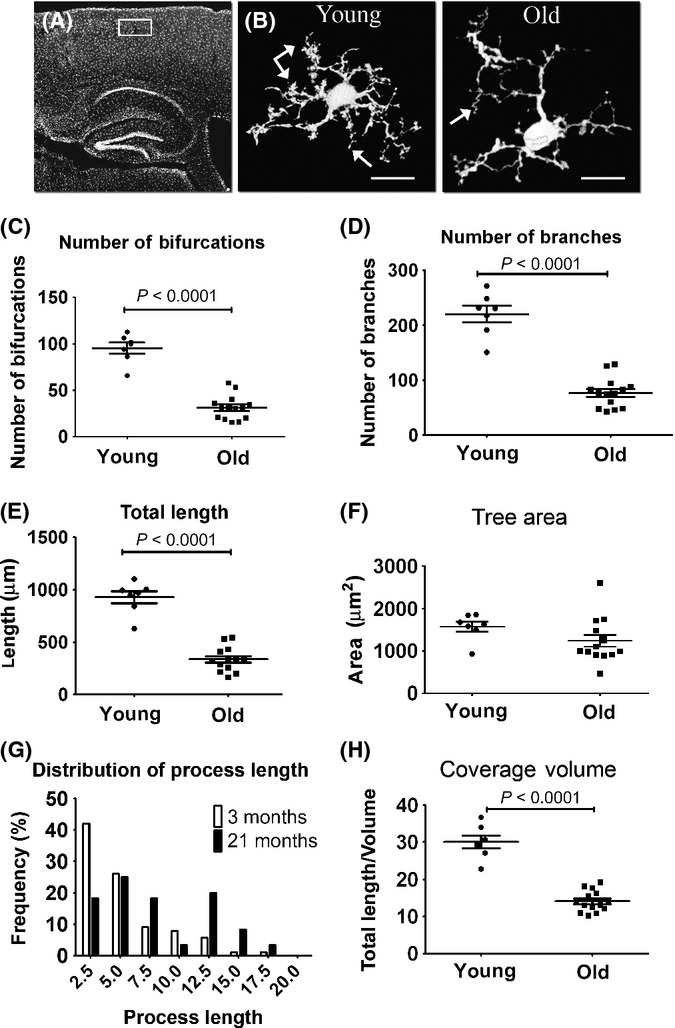
GFP-labeled microglial process complexity deteriorates with aging. Young (3 months old) and old (21 months old) CX3CR1+/GFP Tg mice were killed, and brain sections were quantitatively analyzed for individual microglial morphology. (A) Overview image of a sagittal brain section showing the cortical area (area denoted by a white rectangle) used for morphological analysis. (B) Representative z-projection images of microglia from young (left panel, arrows point to fine tips) and old (right panel, arrows show twisted processes) mice, traced with the Simple Neurite Tracer plug-in. (C–F) Morphological analysis of randomly selected young and old cortical microglia (layer 2/3), preformed with the L-measure software and statistically analyzed with GraphPad. Scatter plot graphs show means (horizontal line) ±SEM, and each dot represents one cell analyzed. Graphs indicate the number of bifurcations (C), the number of branches (D), the total branch length (E), and the total tree area (F) of individual microglia in young (three mice; n = 7 cells) and old (five mice; n = 14 cells) mice. (G) A histogram indicating the distribution of microglial process length. (H) The coverage volume governed by individual microglia cells, depicted by the length of processes in a 10 μm3 unit of tissue. P values were calculated with Student’s t-test. See Experimental procedures for further details. Bar represents 15 μm (young), 10 μm (old).