Figure 4.

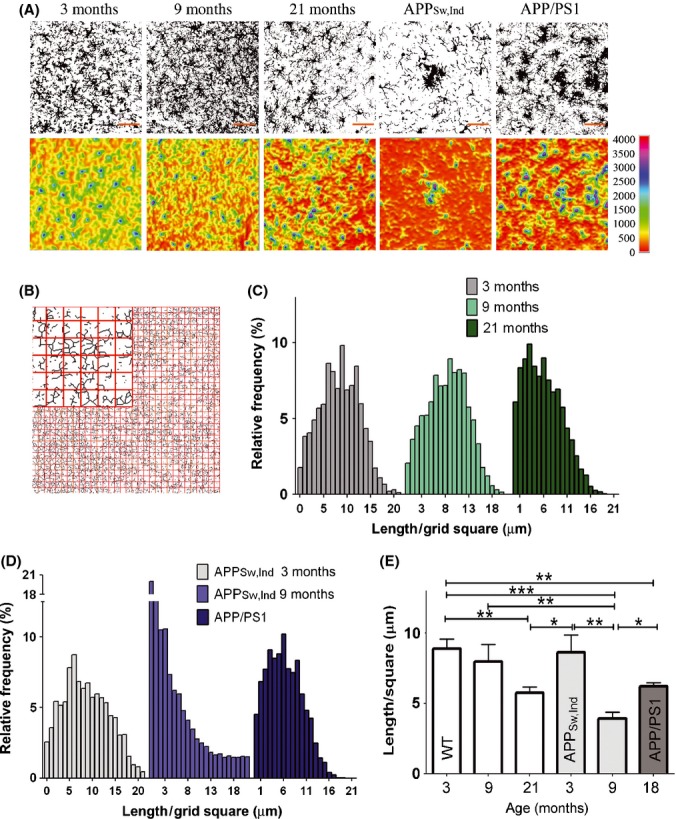
The spatial coverage area of microglia is reduced during aging and in a mouse model of Alzheimer’s disease (AD). Brain sections were taken from WT mice aged 3, 9, and 21 months and from two different AD mouse models, namely the APPSw,Ind (9 months old) and the amyloid precursor proteins (APP)/PS1 (15 months old) Tg mice, and immunolabeled with anti-IbaI. (A) Confocal z-stack images showing microglia process densities. To classify microglia, gray level, maximum z-projection images were generated and then set to eliminate background based on intensity threshold (upper panels). A heat map visualizing microglia process densities (lower panels) was then generated with the 3D Surface Plot plug-in bundled with FIJI software. Areas highly condensed with microglial processes appear in blue-purple, and areas vacant of microglia processes appear in red-yellow. Bars represent 50 μm. (B–E) Spatial coverage of microglia was performed by grid analysis. Grid analysis was performed by opening a grid of 32*32 squares (each square is 25 μm2) on top of a skeletonized image (see a zoom-in image of the grid in panel B). The total calculated length of processes in each square of the grid is presented as a distribution histogram with binning of 1 μm for 3-, 9-, and 21-month-old mice (C) and for APPSw,Ind and, APP/PS1 Tg mice compared with 3-month-old APPSw,Ind Tg mice (D). The length of processes per 1 square of a grid was calculated for each mouse (WT, 3 months n = 3; all other groups n = 5) and averaged for each group. Data were then analyzed by a one-way Tukey’s ANOVA. *P < 0.05; **P < 0.01, ***P < 0.001 (E).
