
Figure 5.
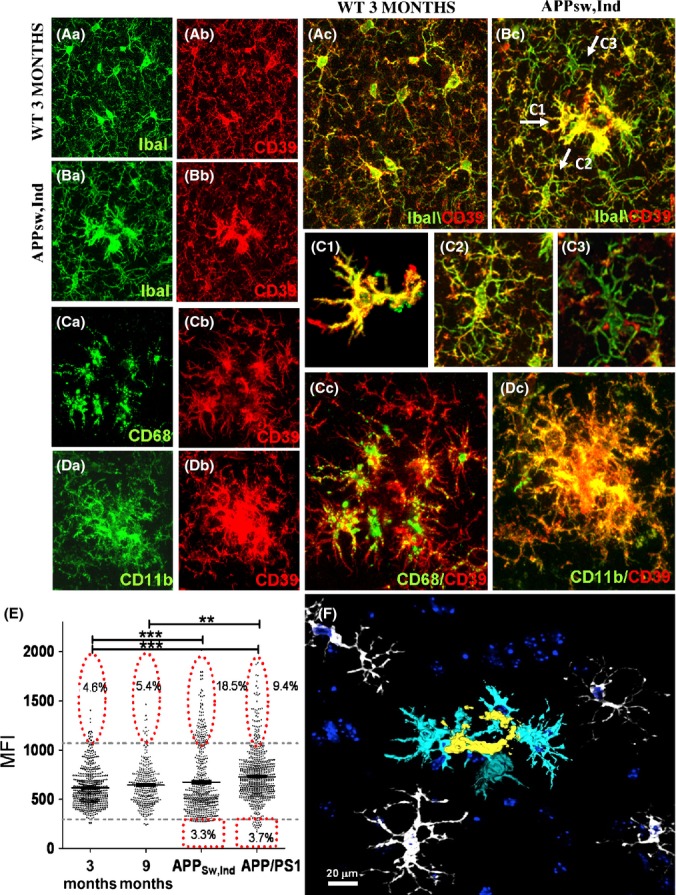
Microglial expression of CD39 is altered in mouse models of Alzheimer’s disease. IbaI and CD39 IHC analyses were performed on brain sections from young, old, and amyloid precursor proteins (APP) Tg mice as described in Experimental procedures. (A, B) Representative z-stack images of WT (aged 3 months) and APPsw,Ind Tg mice (aged 9 months), showing IbaI+ cells (Aa, Ba; green), CD39+ cells (Ab, Bb; red), and the merge images (Ac, Bc) in the cortex. Arrows in Bc point to cells classified as CD39high (C1), CD39+ (C2), and CD39low (C3). (C1–C3) Enlargement of cells depicted in Bc. Cells shown in C1 were traced with Simple Neurite Tracer plug-in followed by process ‘filling’ as detailed in Experimental procedures. (C) Representative z-stack images of APPsw,Ind Tg mice showing cells stained for CD68 (Ca), CD39 (Cb), and merge image (Cc). (D) Representative z-stack images of APPsw,Ind Tg mice stained for CD11b (Da), CD39 (Db), and merge image (Dc). (E) Graph showing CD39 mean fluorescent intensity (MFIs) of IbaI+ cells in images taken from 3- and 21-month-old WT mice and APPSw,Ind (aged 9 months), and APP/PS1 (aged 15 months) Tg mice. Average MFIs were calculated for each experimental group and analyzed by a one-way Tukey’s ANOVA. **P < 0.01, ***P < 0.001. Percent of CD39low and CD39high cells among the CD39+ population was evaluated based on CD39 fluorescence intensity levels. Lower and upper thresholds (horizontal broken lines) were set according to 3-month-old WT mice. (F) A 3-D image of APPsw,Ind stained for IbaI+ cells in the vicinity of Aβ plaques reconstructed with Simple Neurite Tracer plug-in and viewed with 3D Viewer (FIJI software). Three IbaI+ cell populations, distinct by their morphology appearance, are depicted in the image: 1st layer of amoeboid cells (yellow); 2nd layer of cells with enlarged cytoplasm and reduced morphological complexity (light blue); and 3rd layer of ramified cells with reduced morphological complexity (white). Counter staining with TO-PRO-3 appears in dark blue.