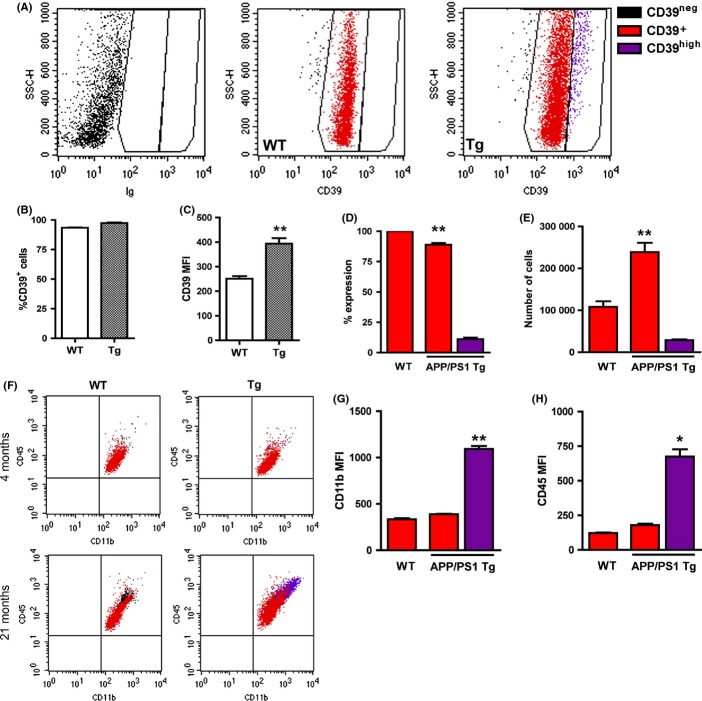
Figure 6.
CD39high cells in amyloid precursor proteins (APP)/PS1 Tg mice have increased expression of CD11b and CD45. (A) Flow cytometry profiles showing CD39 expression by CD11b+CD45+ gated cells in 21-month-old WT and APP/PS1 Tg mice. Cell populations were defined based on fluorescence levels in isotype-stained control (left panel) and identified throughout the figure as CD39− (black), CD39+ (red), and CD39high (purple). Quantification of FACS data showing %CD39+ among CD11b+CD45+ cells (B) and CD39 mean fluorescent intensity (MFI) (C) in WT and APP/PS1 Tg mice. (D) Percent CD39high cells among CD39+ cells. (E) Numbers of CD39+ and CD39high CD11b+CD45+ cells in WT and APP/PS1 Tg mice. (F) CD45/CD11b plots from WT and APP/PS1 Tg mice at 4 and 21 months of age, with CD39 subpopulations identified by multicolor gating, as defined above. CD11b (G) and CD45 (H) MFIs among CD39+ cells in WT and APP/PS1 Tg mice. *P < 0.05, **P < 0.01.

