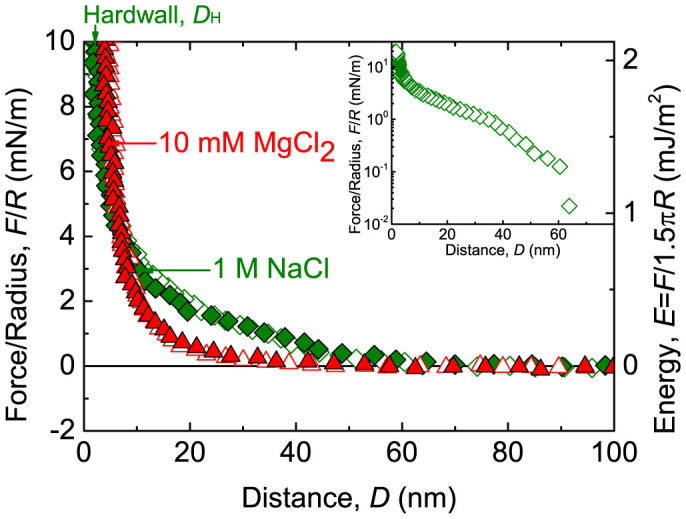
Figure 2. The desorption of the DNA layer on a mica substrate induced by the competition between monovalent and divalent cations.

After DNA adsorption in 10 mM MgCl2 ( ), the buffer was replaced by NaCl solutions with concentrations of 10 mM, 100 mM and 1 M (
 ). The force curves for 10 mM and 100 mM NaCl are not shown. Inset shows the semi-log plot of the in-run data in 1 M NaCl.
