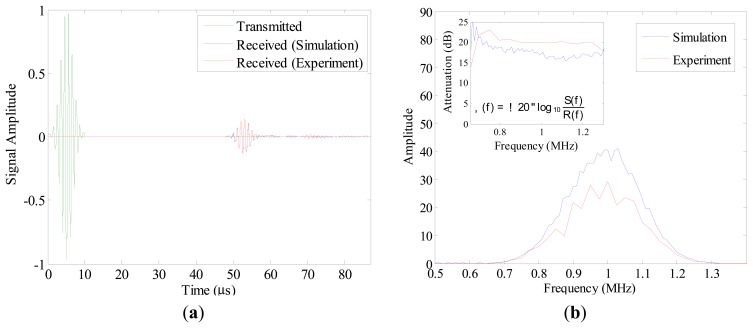
Figure 5.
(a) Time function of the US transducer acting as transmitter, mean of 20 measurements and output of the reference simulation; (b) Amplitude spectra of the simulated signal and the mean signal recorded in experiment. In small window, attenuations [dB] in the simulated model and in the experiment are shown. Attenuations were calculated based on the provided formula, where α (f) is the attenuation [dB], log10 is the logarithm to the base 10, R(f) and S(f) respectively are the amplitude spectrum of the reference waveform (i.e., input signal) and the amplitude spectrum of a receiver waveform (i.e., received signal in experiment or in the reference simulation).

