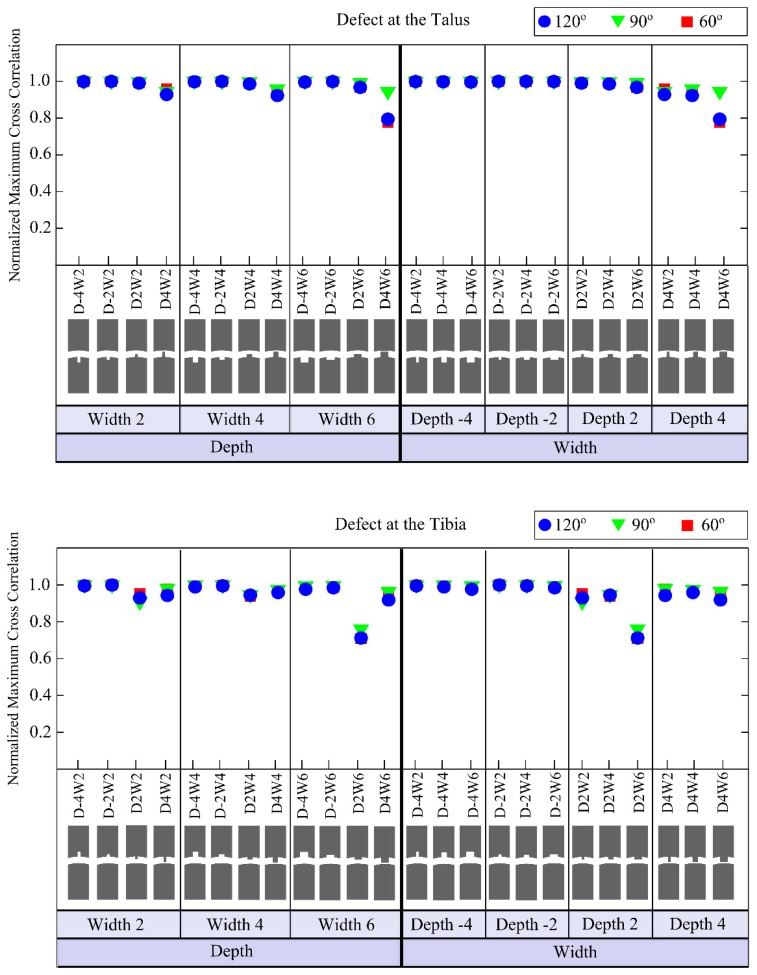
Figure 9.
Normalized maximum cross correlation (NMCC) for models simulating defects located on the talus (i.e., first graph) and on the tibia (i.e., second graph). The first three columns of the first and second graphs are provided to clearly represent the effects of varying defects depths when the defect width was fixed at 2 mm, 4 mm or 6 mm. The last four columns are presented to easily capture the changes related to the varying defects widths when the defect depth was fixed at −4 mm, −2 mm, 2 mm or 4 mm. Negative values for defect depth are used to represent actual holes in the bone, while positive values are used to describe positive defects, which may occur in the stage IV lesions (i.e., detached and displaced osteochondral fragment). In the first and second graphs, depth and width of defect are represented by a “D” and a “W”, respectively. The minus sign “-” is used to describe negative defect, an actual hole in the bone (e.g., D-2W6 represents negative defect, i.e., a hole, with a depth of 2 mm and a width of 6 mm).

