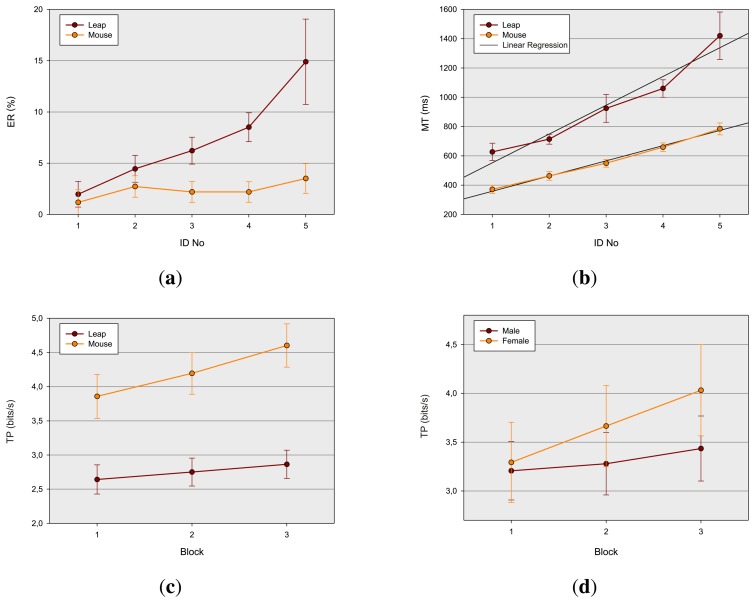
Figure 4.
Results of the experiment: (a) error rate (ER) by device and index of difficulty (ID); (b) movement time (MT) by device and ID with linear regression lines fitted to the data; (c) throughput (TP) by block and device; and (d) TP by block and gender. Error bars indicate the 95-percent confidence intervals.

