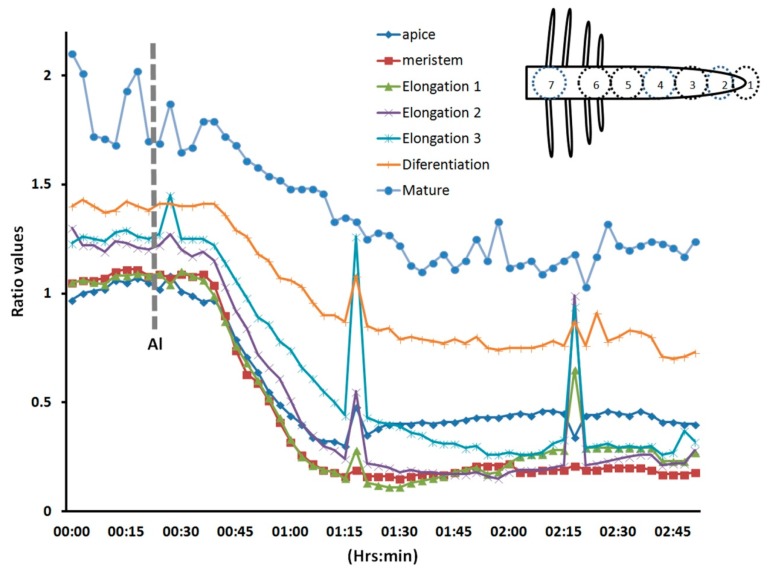
Figure 6.
Different regions of the roots respond with a similar pattern, but the elongation region exhibits the most dramatic change. Different regions of Arabidopsis roots treated with 1 mM Al were evaluated for changes in intracellular H2O2 levels (see inset). Note that all the regions responded at the same time, but with a different strength. 1 = apical, 2 = meristem, 3 = elongation 1, 4 = elongation 2, 5 = elongation 3, 6 = differentiation, 7 = mature.

