Table 1.
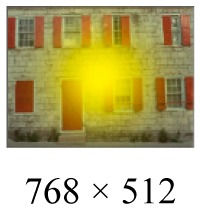
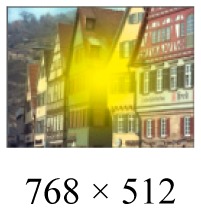
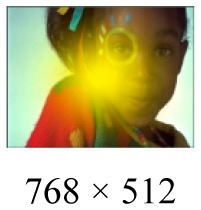
Comparison of restoration performance and processing time for three test images, where the center region is blurred by Gaussian with σ = 3.0, and the peripheral region is blurred with σ = 0.8.
| Input Image | Restoration Method | PSNR [dB] | MSSIM | Average Processing Time [second] | ||||
|---|---|---|---|---|---|---|---|---|
|
| ||||||||
| ση = 0.001 | 0.0001 | 0.00001 | ση = 0.001 | 0.0001 | 0.00001 | |||

|
Dong [24] | 18.81 | 20.43 | 20.59 | 0.69 | 0.79 | 0.81 | 309.5804 |
| Yang [25] | 22.92 | 23.29 | 22.94 | 0.78 | 0.87 | 0.91 | 5.5511 | |
| Xu [12] | 18.77 | 22.01 | 22.23 | 0.75 | 0.84 | 0.84 | 1736.3780 | |
| Shen [14] | 23.81 | 25.62 | 25.76 | 0.82 | 0.90 | 0.91 | 66.1389 | |
| Proposed | 24.43 | 26.75 | 27.47 | 0.83 | 0.91 | 0.92 | 0.6401 | |
|
| ||||||||

|
Dong [24] | 17.96 | 19.46 | 19.57 | 0.74 | 0.83 | 0.85 | 315.0760 |
| Yang [25] | 22.13 | 22.64 | 22.03 | 0.83 | 0.89 | 0.93 | 5.8107 | |
| Xu [12] | 15.02 | 18.00 | 18.10 | 0.66 | 078 | 0.79 | 1592.6384 | |
| Shen [14] | 22.31 | 23.34 | 23.35 | 0.86 | 0.91 | 0.92 | 68.7075 | |
| Proposed | 22.38 | 25.21 | 25.84 | 0.87 | 0.93 | 0.94 | 0.5869 | |
|
| ||||||||

|
Dong [24] | 24.57 | 28.87 | 29.88 | 0.60 | 0.86 | 0.93 | 287.5568 |
| Yang [25] | 25.40 | 25.88 | 25.77 | 0.65 | 0.79 | 0.88 | 4.8221 | |
| Xu [12] | 20.29 | 29.57 | 30.17 | 0.73 | 0.91 | 0.94 | 2025.9904 | |
| Shen [14] | 26.55 | 31.72 | 31.55 | 0.79 | 0.93 | 0.94 | 72.4971 | |
| Proposed | 28.36 | 31.48 | 32.78 | 0.81 | 0.94 | 0.96 | 0.5938 | |
