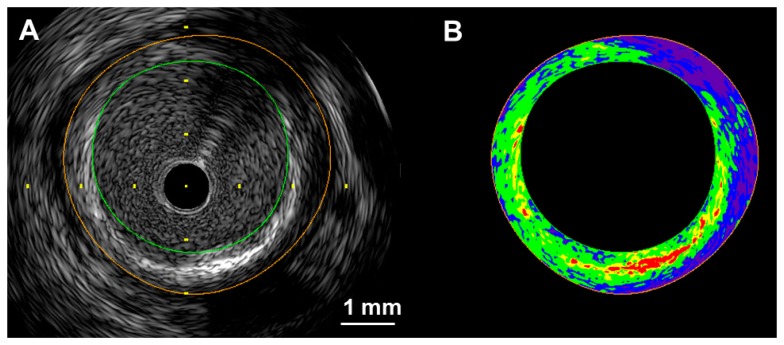
Figure 2.
A two-dimensional color-coded map of the coronary arterial plaque. Conventional IVUS images and IB-IVUS color-coded maps were displayed side-by-side on a monitor. Calculation of the relative area of each tissue characteristic was automatically performed by computer software. (A) Conventional IVUS image; (B) Two-dimensional color-coded map (red: calcification, yellow: dense fibrosis, green: fibrosis, blue and purple: lipid pool). The overall agreement between the classifications made by IB-IVUS and histology (lipid-rich, fibrous and fibrocalcific) was excellent (κ = 0.83, 95% CI: 0.73–0.92) [14].

