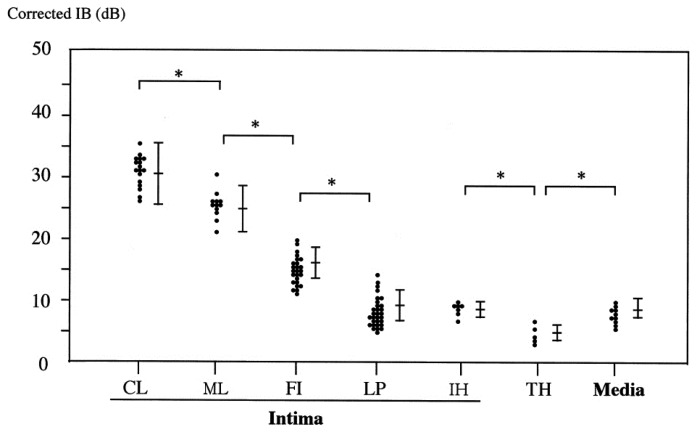
Figure 3.
Corrected IB values of various tissue types. The corrected IB values from calcification (CL), mixed lesion (ML), fibrosis (FI), thrombus (TH) and lipid pool (LP), intimal hyperplasia (IH) or media are significantly different from each other. However, there are no significant differences among lipid pool, intimal hyperplasia and media. Mixed lesion: the region in which calcification and fibrosis were mixed. *p < 0.05.

