
Fig. 2.
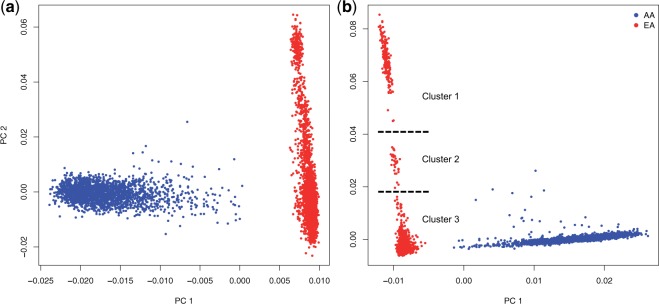
PCA of common and rare variation. (a) PCA results for the first two principal components of the 6,515 ESP individuals using common variants (MAF ≥ 10%). AA are in blue and EA are in red. (b) PCA results for the same individuals using rare variants (MAF ≤ 0.5%).